3.1. Airfoil
3.1.1. Build an airfoil
This example demonstrates how to build an airfoil with CST parameters,
using the cst_foil function.
It takes the CST parameters of the upper surface and lower surface as input.
You need to specify the number of points on the airfoil with n.
You can provide a reference x-coordinate distribution with x.
You can specify the maximum relative thickness of the airfoil \(t_\text{max}\) with t.
You can also add a trailing edge thickness with tail.
Then, it returns the x-coordinates, y-coordinates of the upper surface and lower surface,
the maximum thickness, and the leading edge radius.
1import numpy as np
2from cst_modeling.section import cst_foil
3
4cst_u = np.array([ 0.118598,  0.118914,  0.155731,  0.136732,  0.209265,  0.148305,  0.193591])
5cst_l = np.array([-0.115514, -0.134195, -0.109145, -0.253206, -0.012220, -0.118463,  0.064100])
6
7x1, yu1, yl1, tmax1, rLE1 = cst_foil(201, cst_u, cst_l, x=None, t=None, tail=0.0)
8x2, yu2, yl2, tmax2, rLE2 = cst_foil(201, cst_u, cst_l, x=None, t=None, tail=0.004)
9x3, yu3, yl3, tmax3, rLE3 = cst_foil(201, cst_u, cst_l, x=None, t=0.11, tail=0.004)
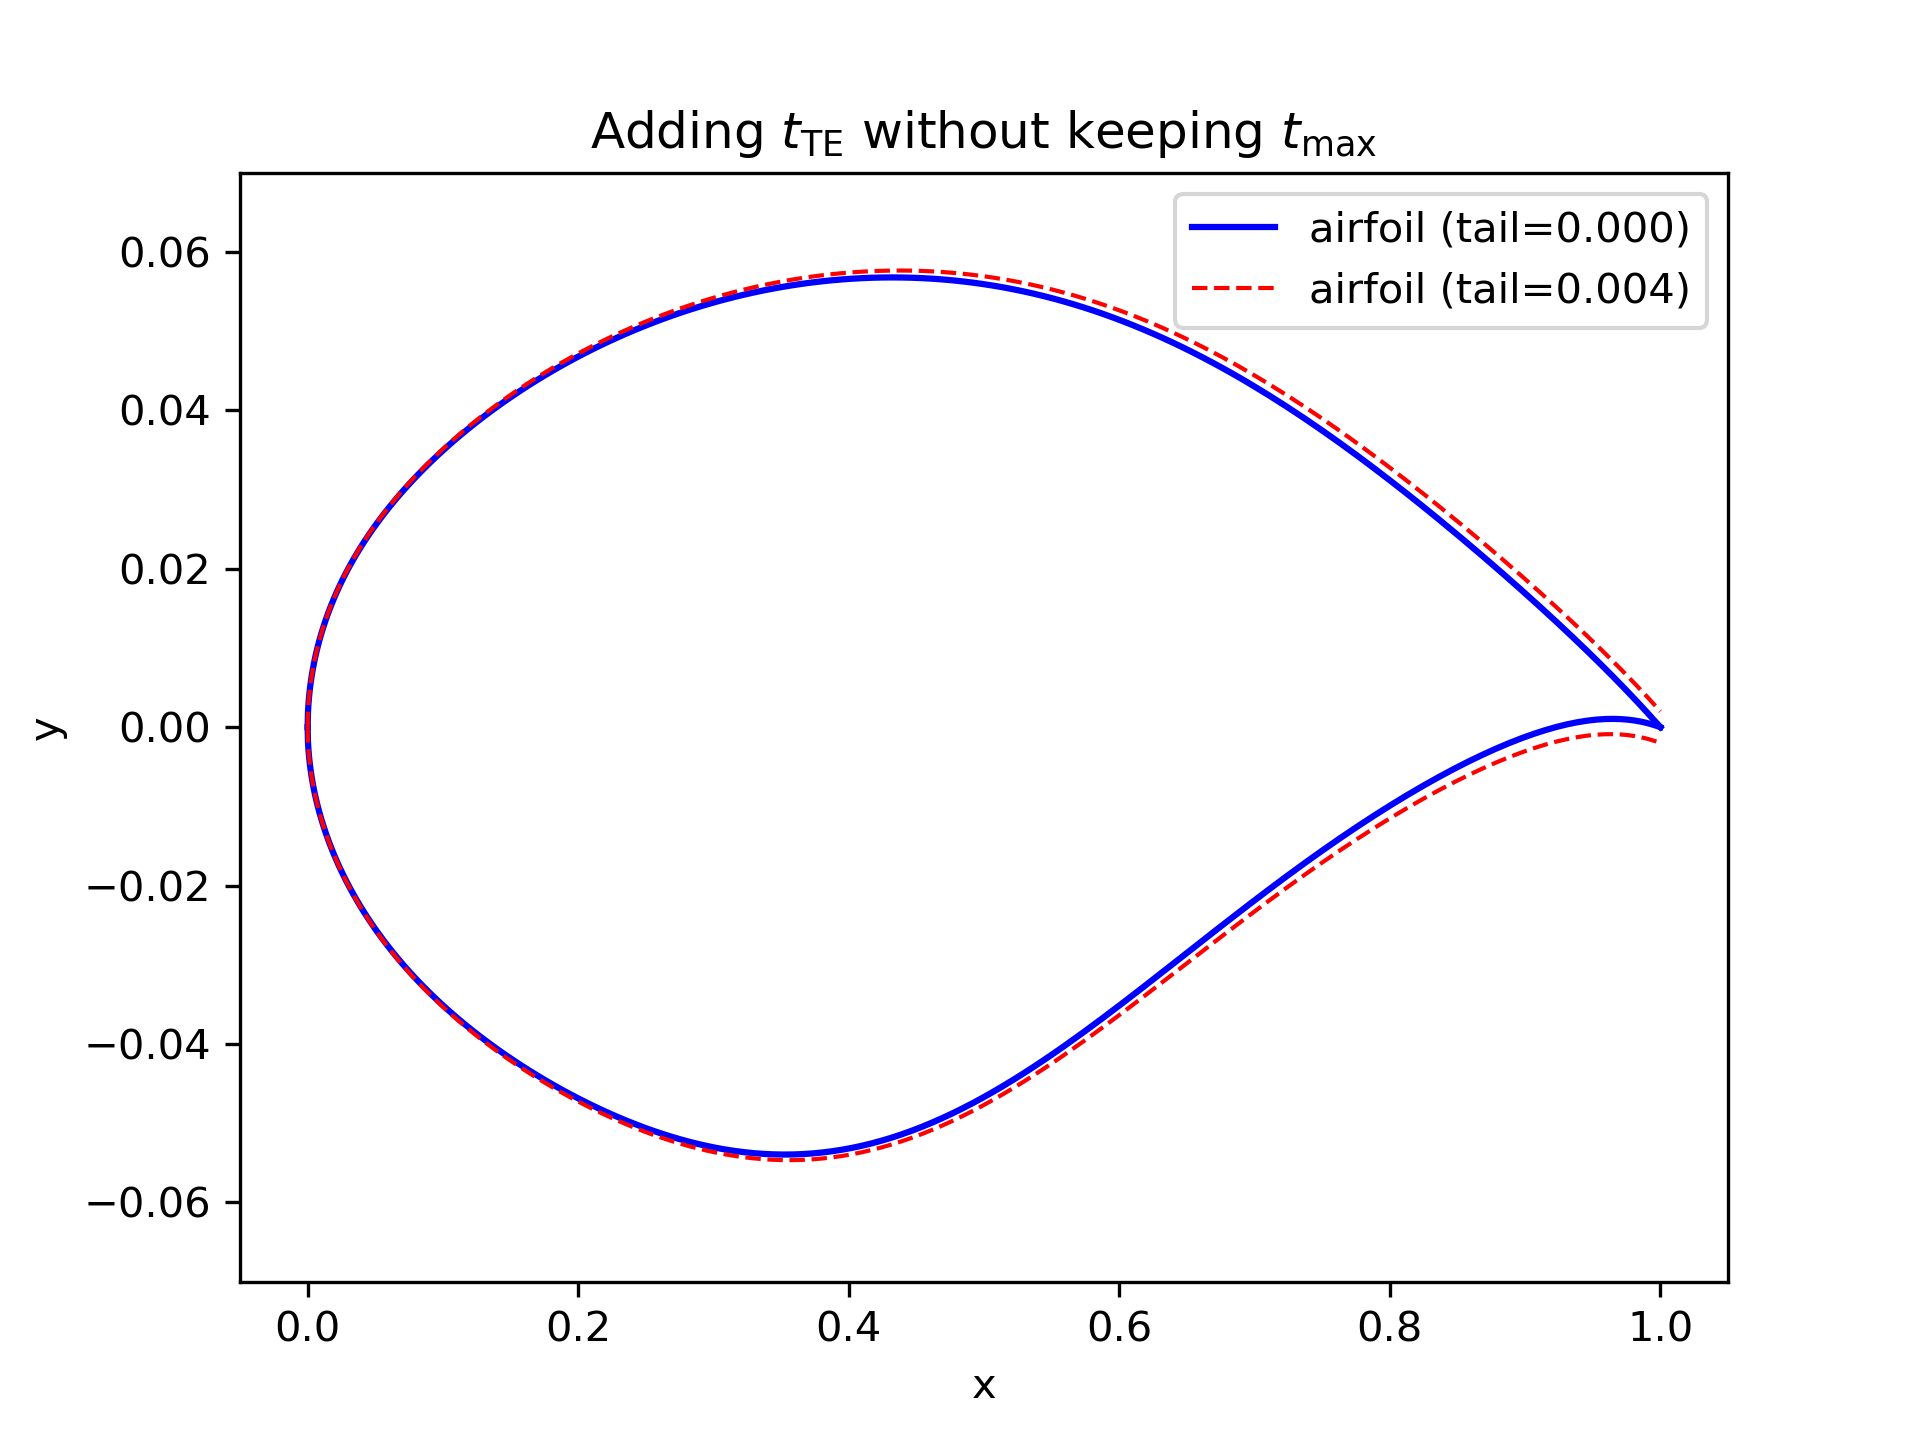
Figure 3.1.1 Airfoil with and without trailing edge thickness
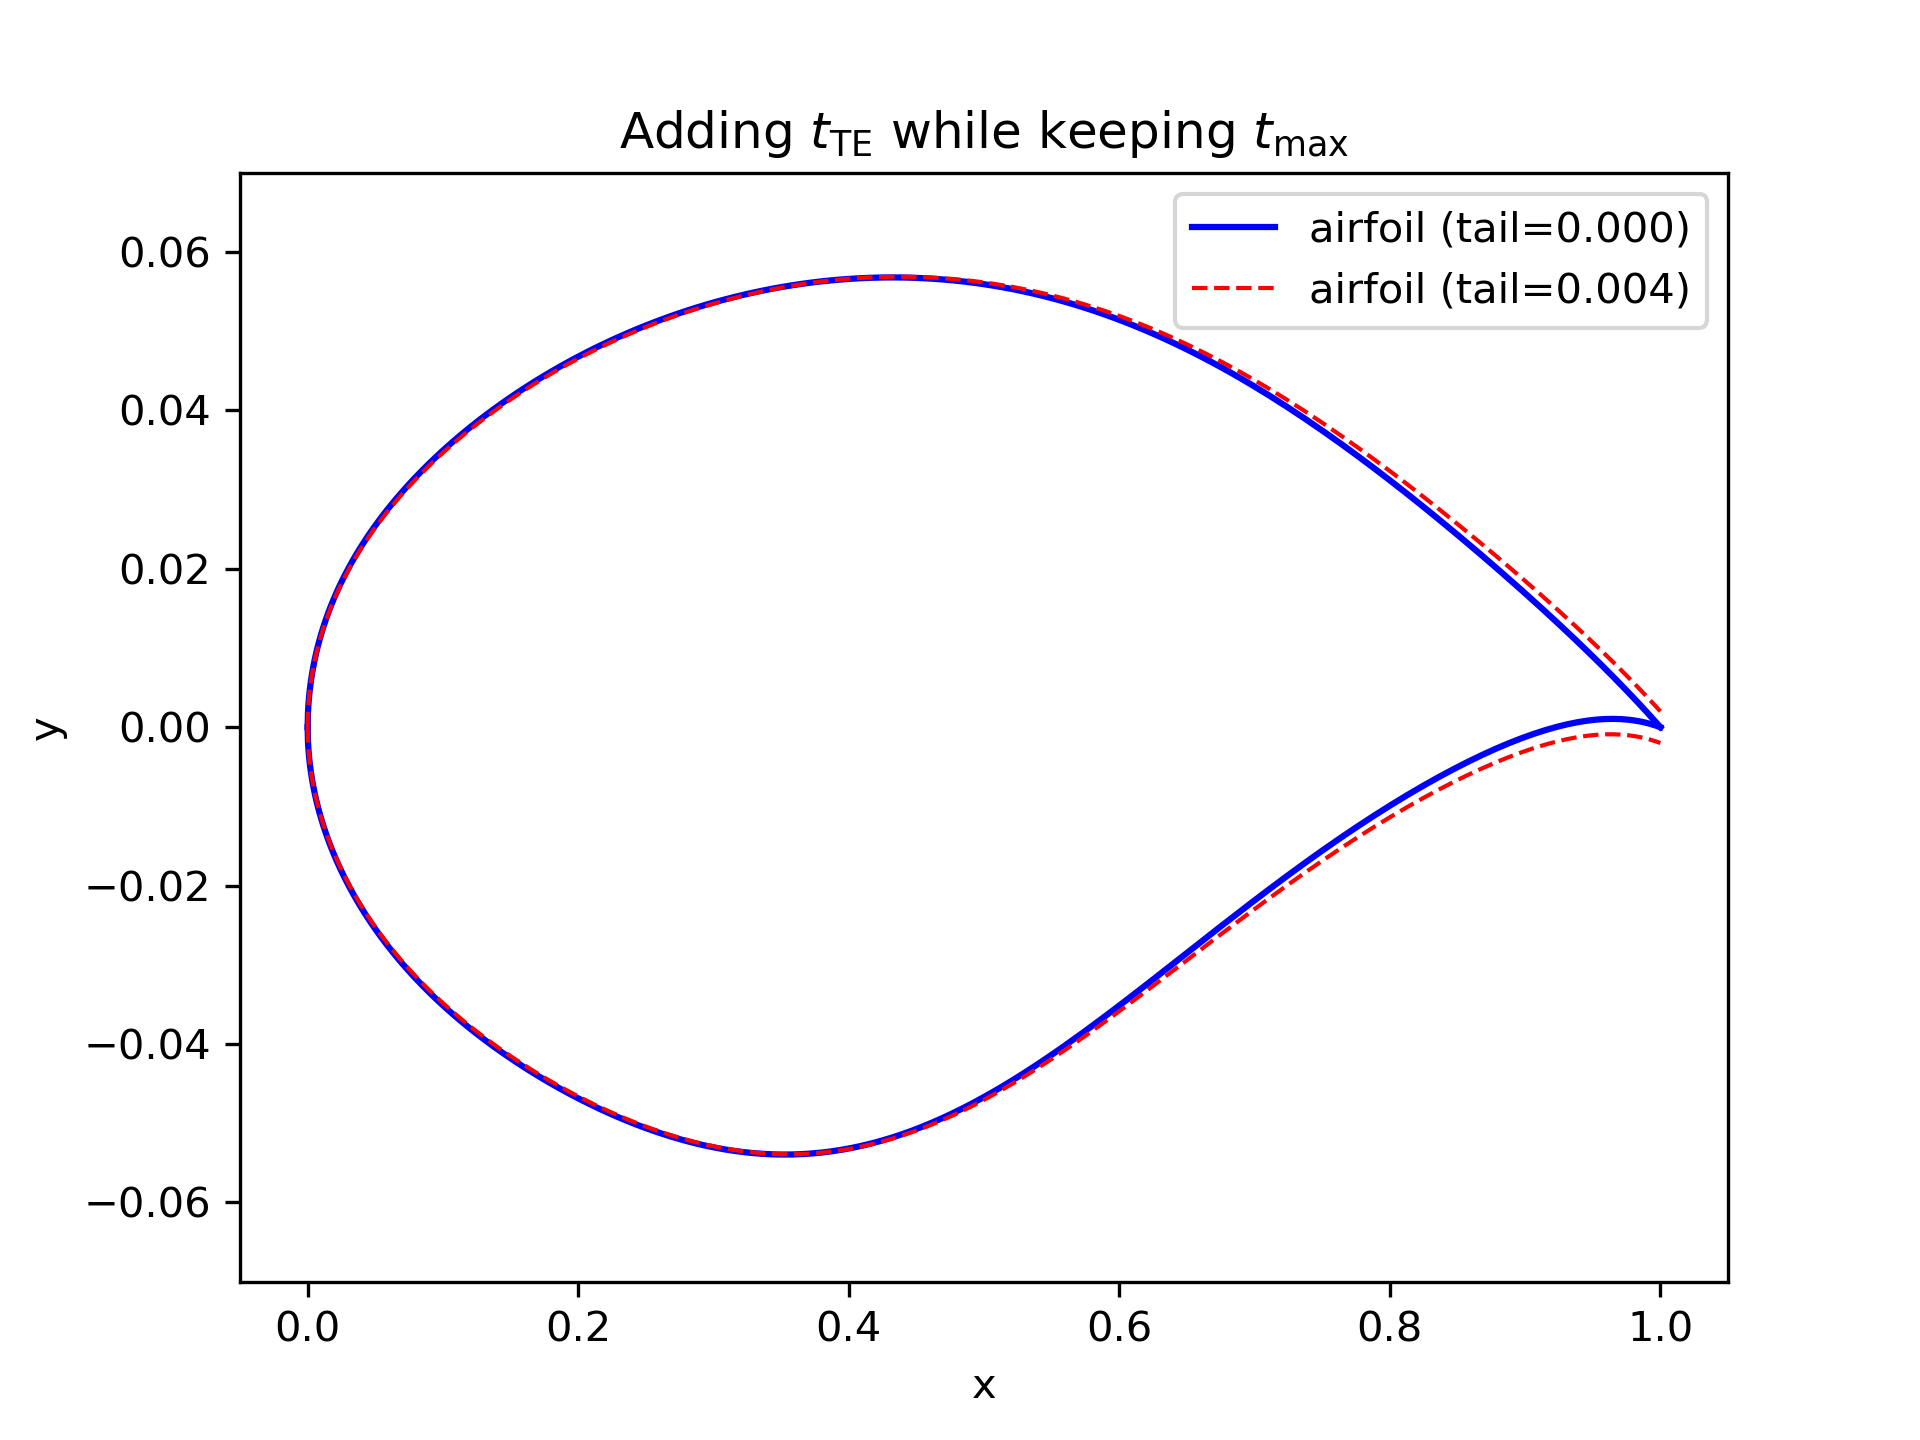
Figure 3.1.2 Airfoil with and without trailing edge thickness (same \(t_\text{max}\) ).
3.1.2. Fit airfoil raw data points
Sometimes, you may have raw data points of an airfoil and want to get the CST parameters.
This example demonstrates how to fit the CST parameters from raw data points,
using the cst_foil_fit function.
You need to provide the raw data points of the upper surface and lower surface,
i.e., xu0, yu0, xl0, yl0. You can also specify the number of CST parameters with n_cst.
1from cst_modeling.section import cst_foil_fit
2
3cst_u, cst_l = cst_foil_fit(xu0, yu0, xl0, yl0, n_cst=10)
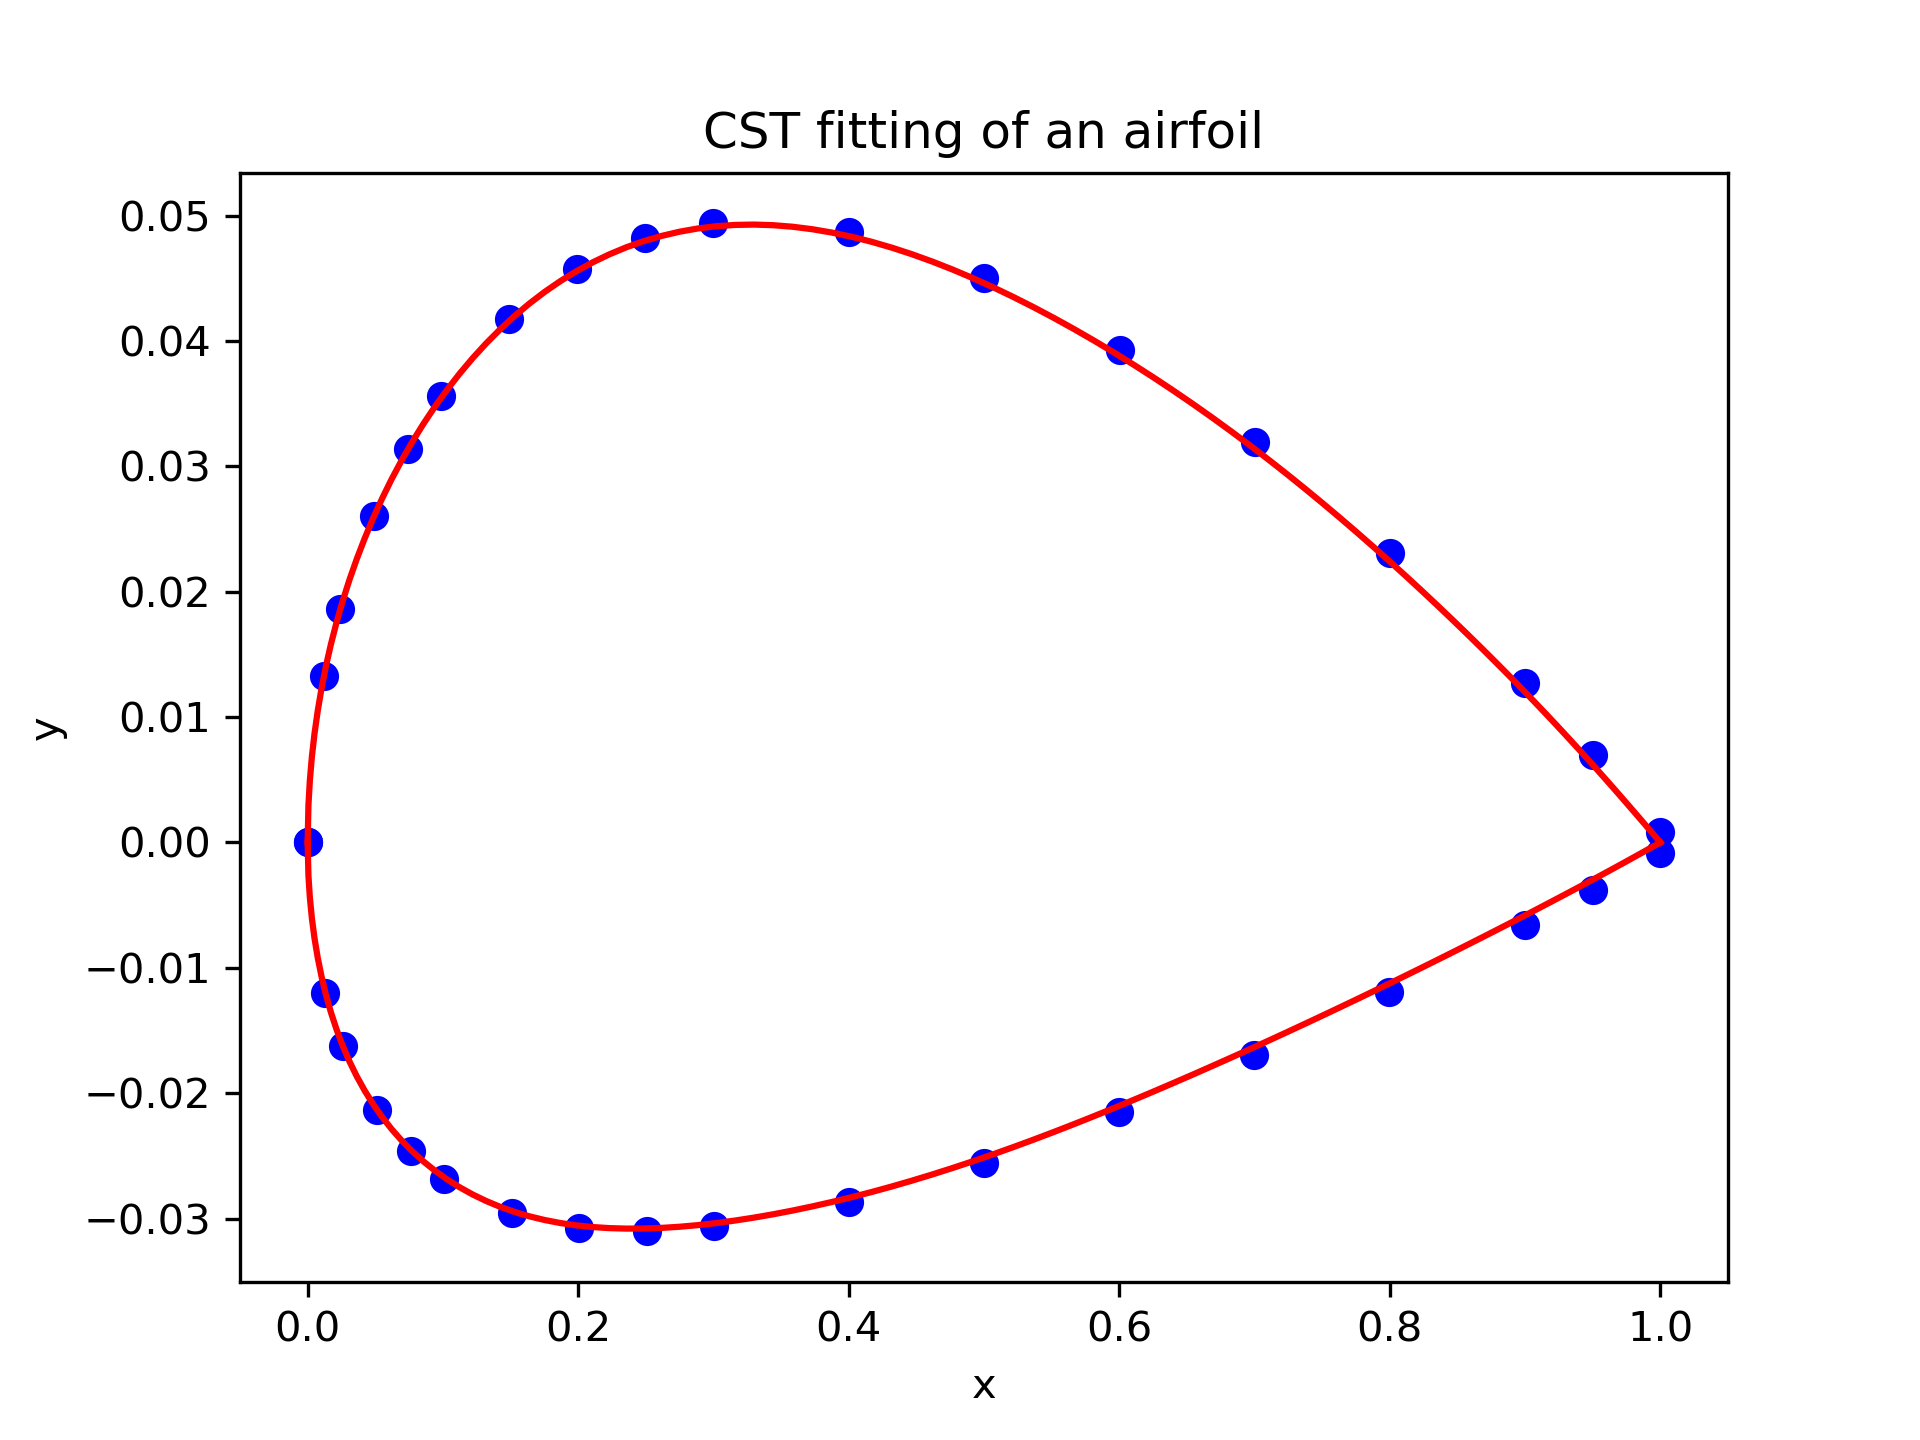
Figure 3.1.3 Fitting airfoil raw data points with CST method.
3.1.3. Airfoil data output
When you need to output the airfoil data to a file, you can use the following code.
The output_foil function outputs the 2D airfoil data in the Tecplot format.
The output_plot3d function outputs the 2D airfoil data in the Plot3D format.
The output_curves_igs function outputs the 2D airfoil data in the IGES format.
 1from cst_modeling.section import cst_foil
 2from cst_modeling.basic import output_foil, output_curves_igs, output_plot3d
 3
 4xx, yu, yl, _, _ = cst_foil(101, cst_u, cst_l, x=None, t=None, tail=0.0)
 5
 6output_foil(xx, yu, yl, fname='airfoil-2d.dat')
 7
 8x = [xx[None,:], xx[None,:]]
 9y = [yu[None,:], yl[None,:]]
10z = [np.zeros_like(x[0]), np.zeros_like(x[0])]
11
12output_plot3d(x, y, z, fname='airfoil-2d.xyz')
13
14x = np.concatenate(x, axis=0)*1000
15y = np.concatenate(y, axis=0)*1000
16z = np.zeros_like(x)
17
18output_curves_igs(x, y, z, fname='airfoil-2d.igs', n_degree=3, is_planar=True)
3.1.4. Build a 3D airfoil
Sometimes, you may need to build a 3D airfoil from the 2D airfoil data.
Then, you need the BasicSection
and BasicSurface (or an old version BasicSurface) classes.
You can specify how the surface is output, such as whether the upper and lower surfaces are output separately or together,
or whether combine the span-wise sections into one piece. Please refer to the function document for details.
 1from cst_modeling.basic import BasicSection, BasicSurface
 2from cst_modeling.section import cst_foil
 3
 4#* Build a 2D section
 5xx, yu, yl, _, _ = cst_foil(101, cst_u, cst_l, x=None, t=None, tail=0.0)
 6
 7airfoil = BasicSection(thick=None, chord=1.0, twist=0.0)
 8
 9airfoil.xx = xx
10airfoil.yu = yu
11airfoil.yl = yl
12
13#* Build a 3D surface
14geo3d = BasicSurface(n_sec=0, name='wing', nn=airfoil.xx.shape[0], ns=5)
15
16geo3d.secs = [airfoil]
17
18geo3d.geo()
19
20# Output Tecplot format and Plot3D format data
21geo3d.output_tecplot(fname='wing.dat')
22
23geo3d.output_plot3d(fname='wing.xyz')
24
25#* Format transformation: wing.xyz to wing.igs
26plot3d_to_igs(fname='wing')
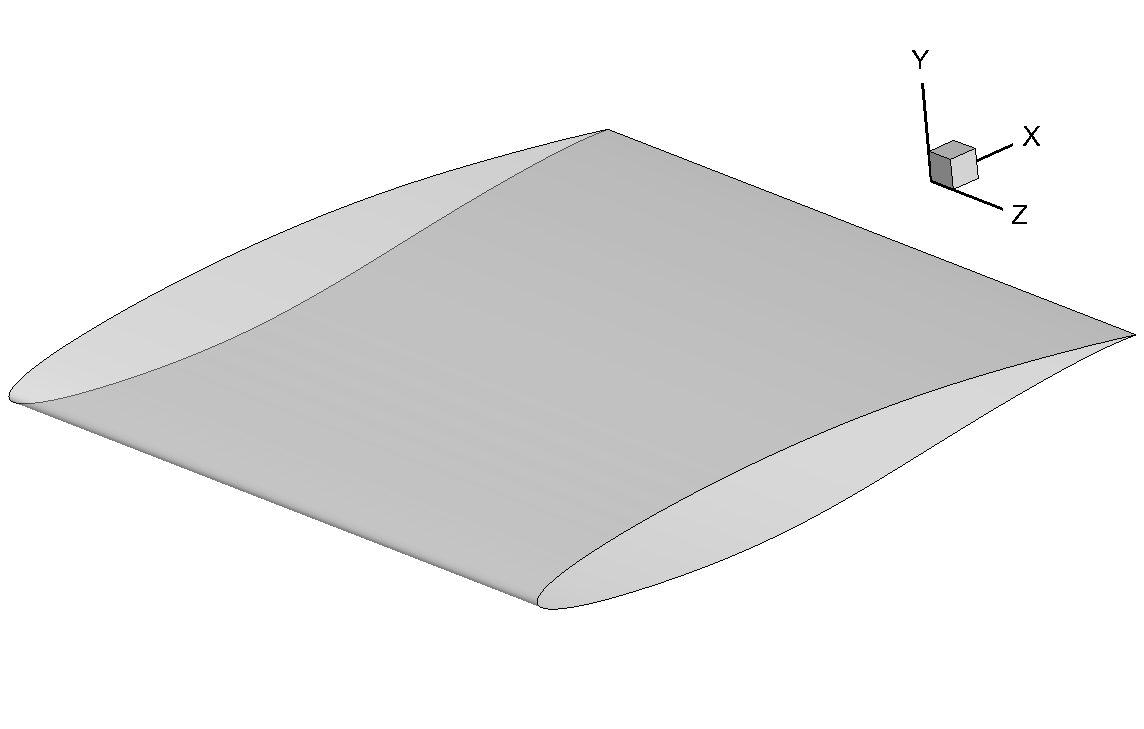
Figure 3.1.4 3D airfoil surface
3.1.5. Extract geometric features
This example demonstrates how to extract geometric features from the airfoil data,
using the FoilGeoFeatures class.
Geometric features:
Leading edge radius
Volume
Thickness line
Camber line
Curvature
Maximum thickness
Thickness at 20% chord and 70% chord
Maximum camber
Average camber
Weighted average camber
Average camber of front 60% and rear 40%
Leading edge slope angle
Trailing edge wedge angle
Trailing edge slope angle
Upper crest point
Lower crest point
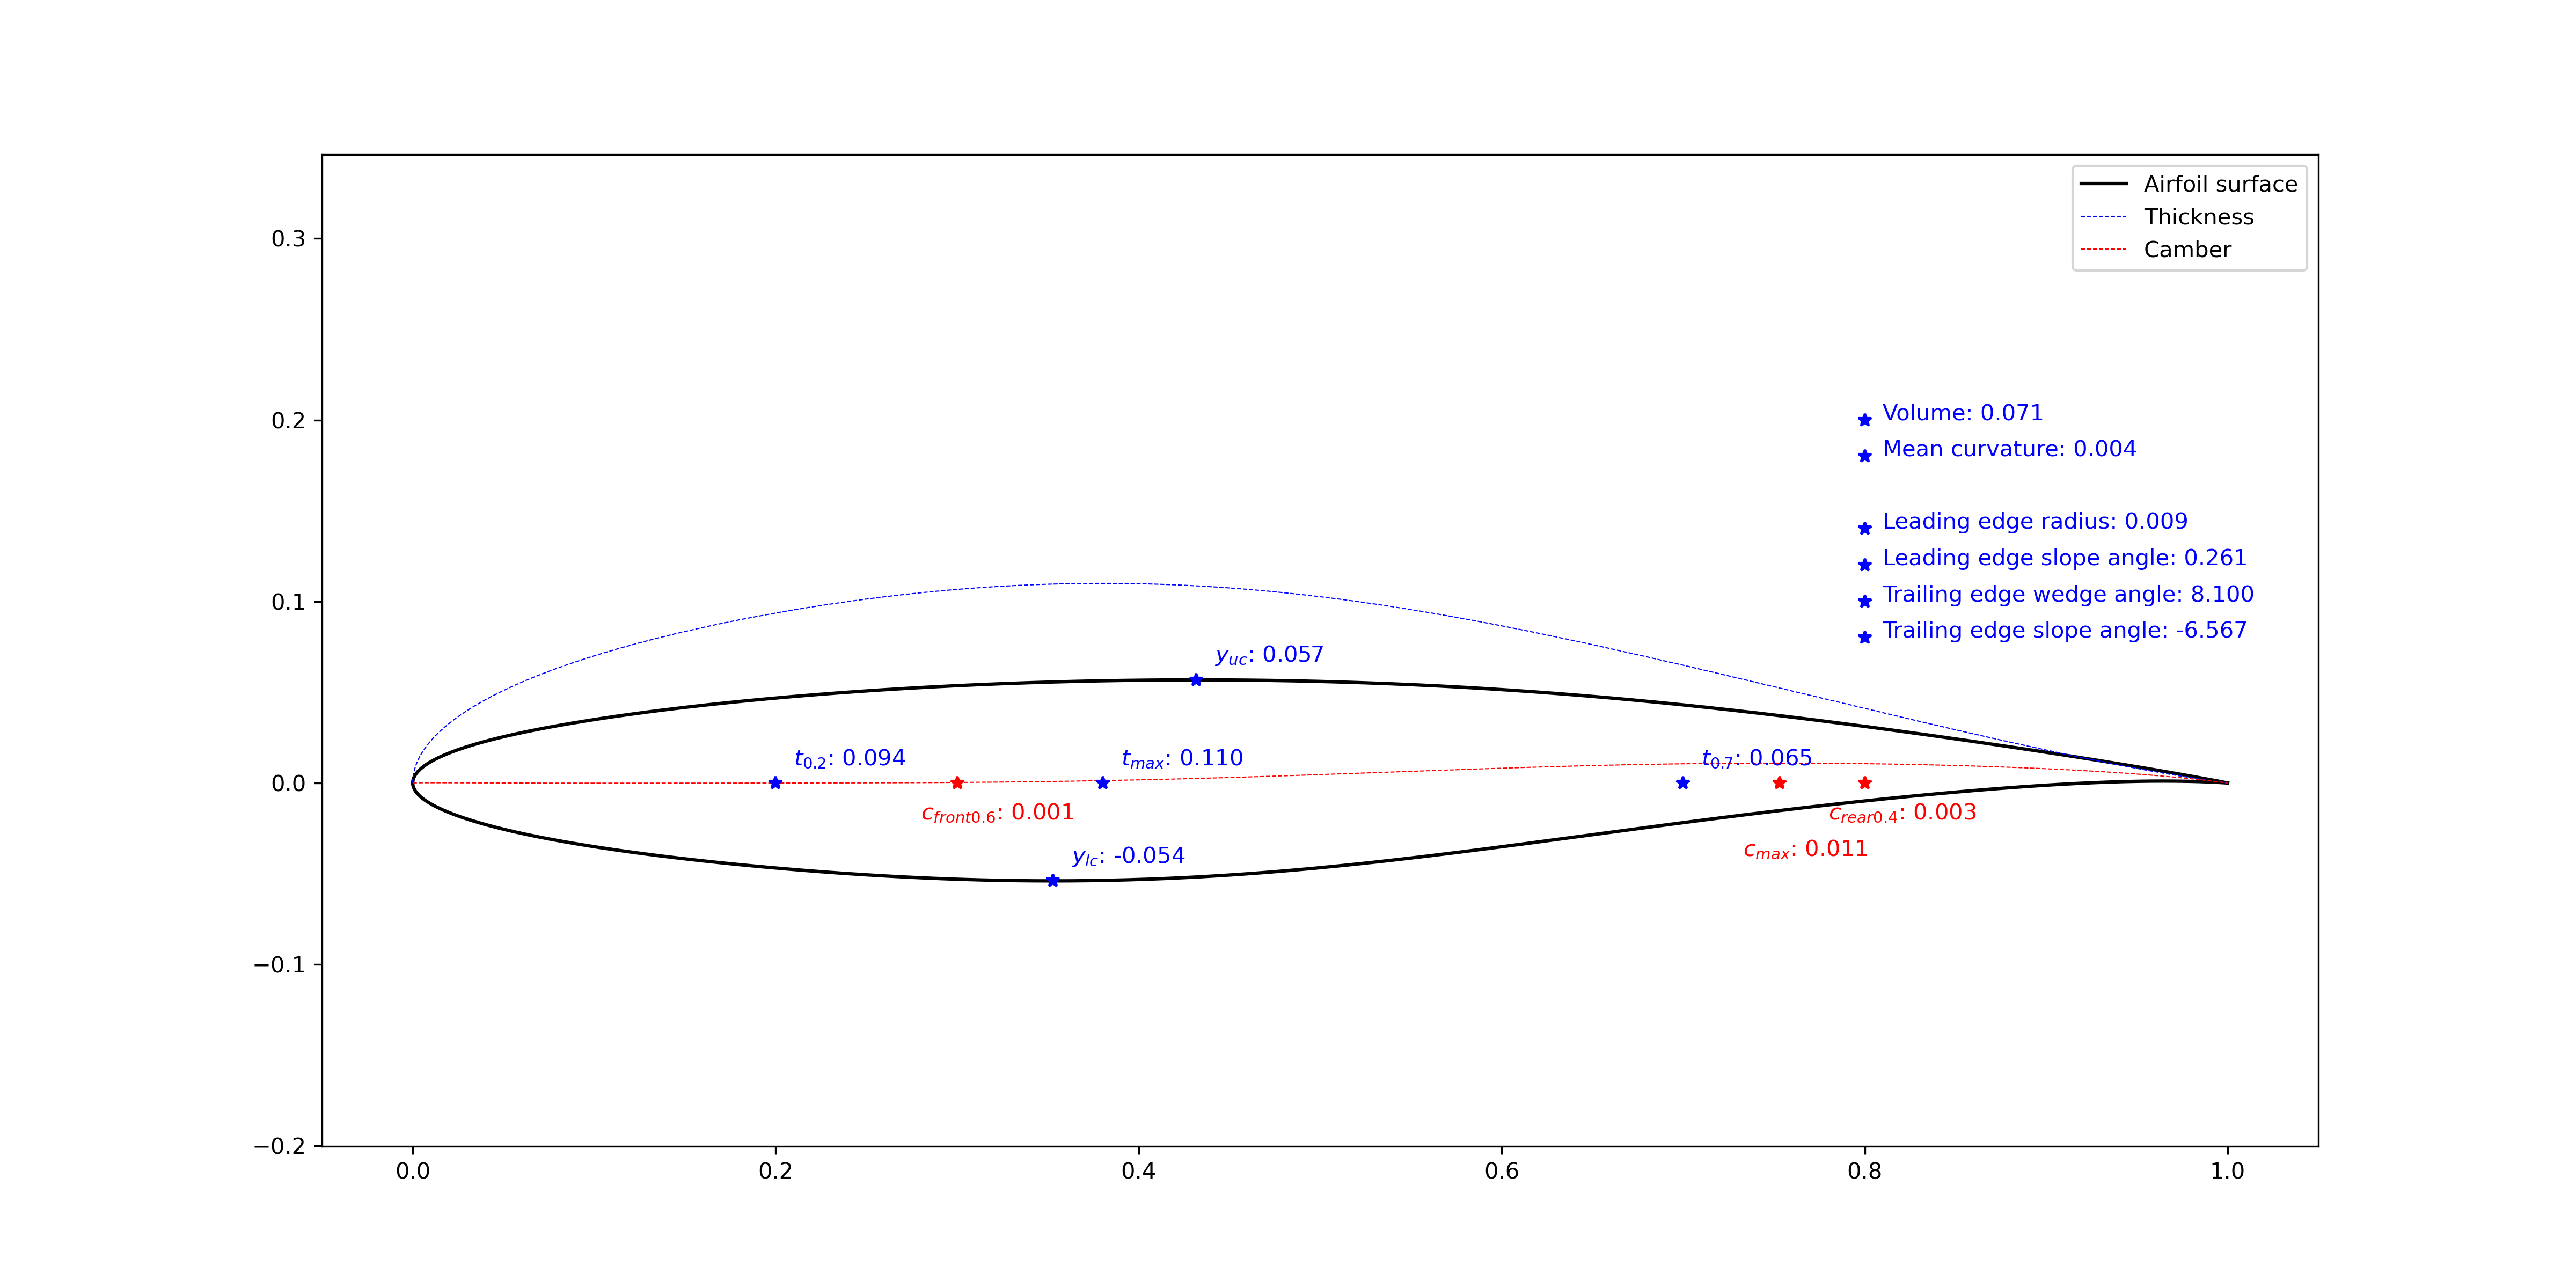
Figure 3.1.5 Airfoil geometric features (tail=0.000)
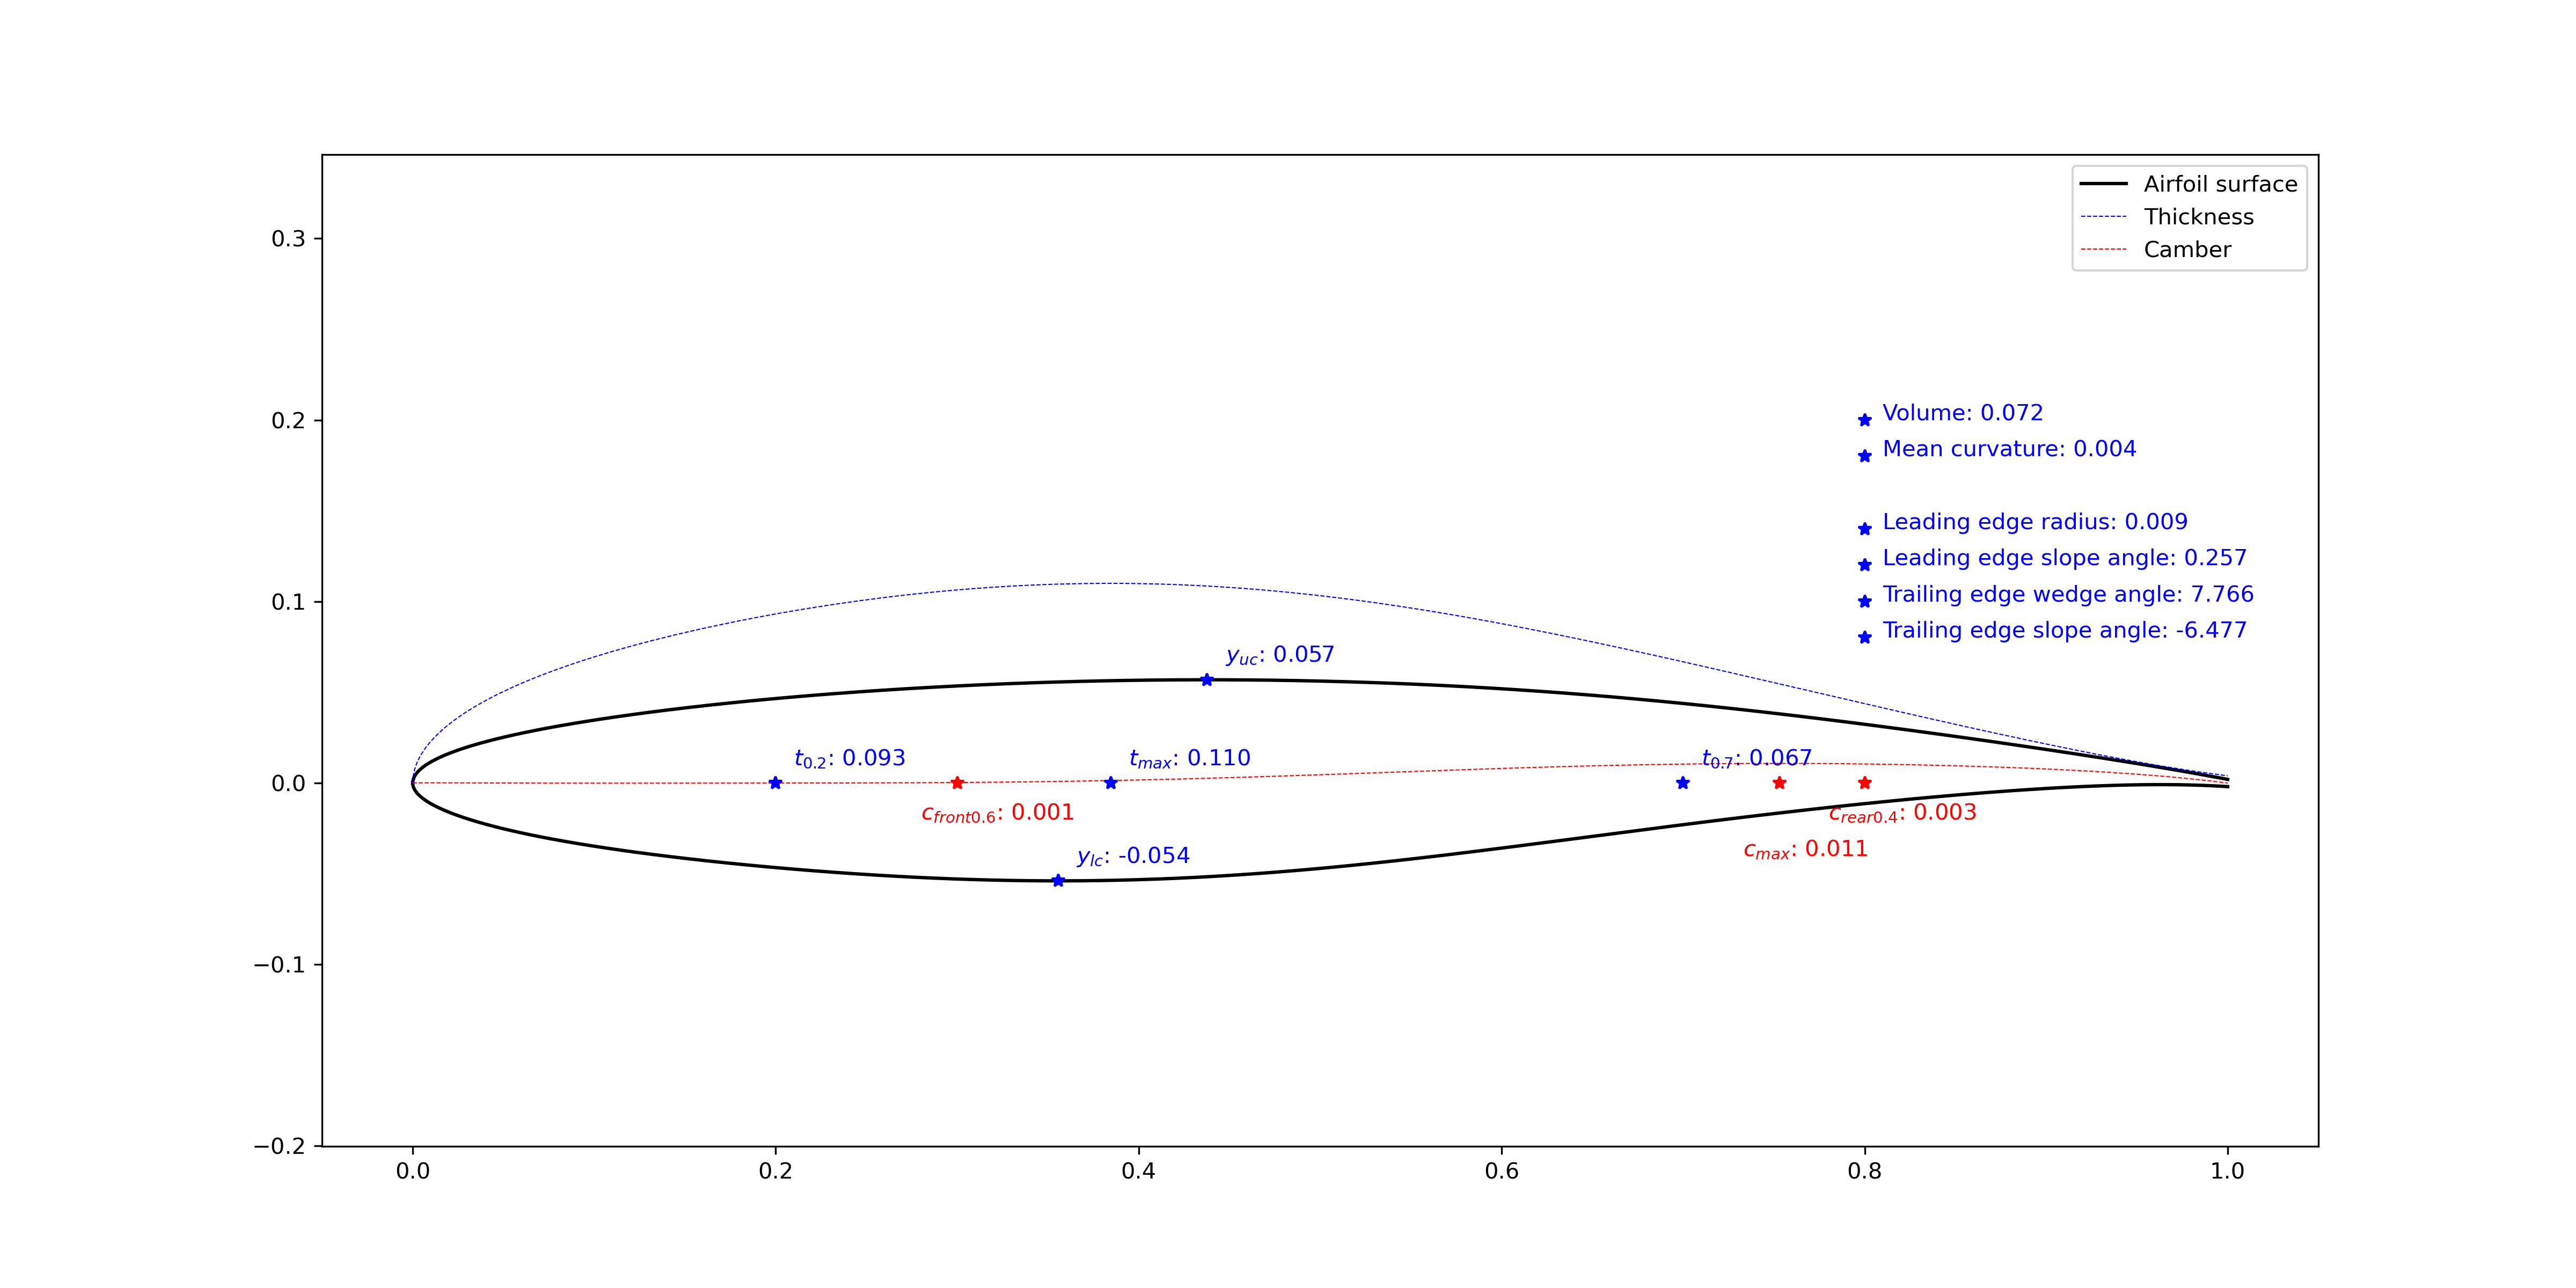
Figure 3.1.6 Airfoil geometric features (tail=0.004)
3.1.6. Modify airfoil geometry
This example demonstrates how to modify the airfoil geometry,
using the FoilModification class.
You can modify the geometry by adding bumps and incremental curves,
the modified geometry will be reconstructed by the CST method with the specified number of CST parameters.
You can also add bumps to the airfoil thickness line or camber line. Or set leading edge radius, trailing edge wedge angle and slope angle.
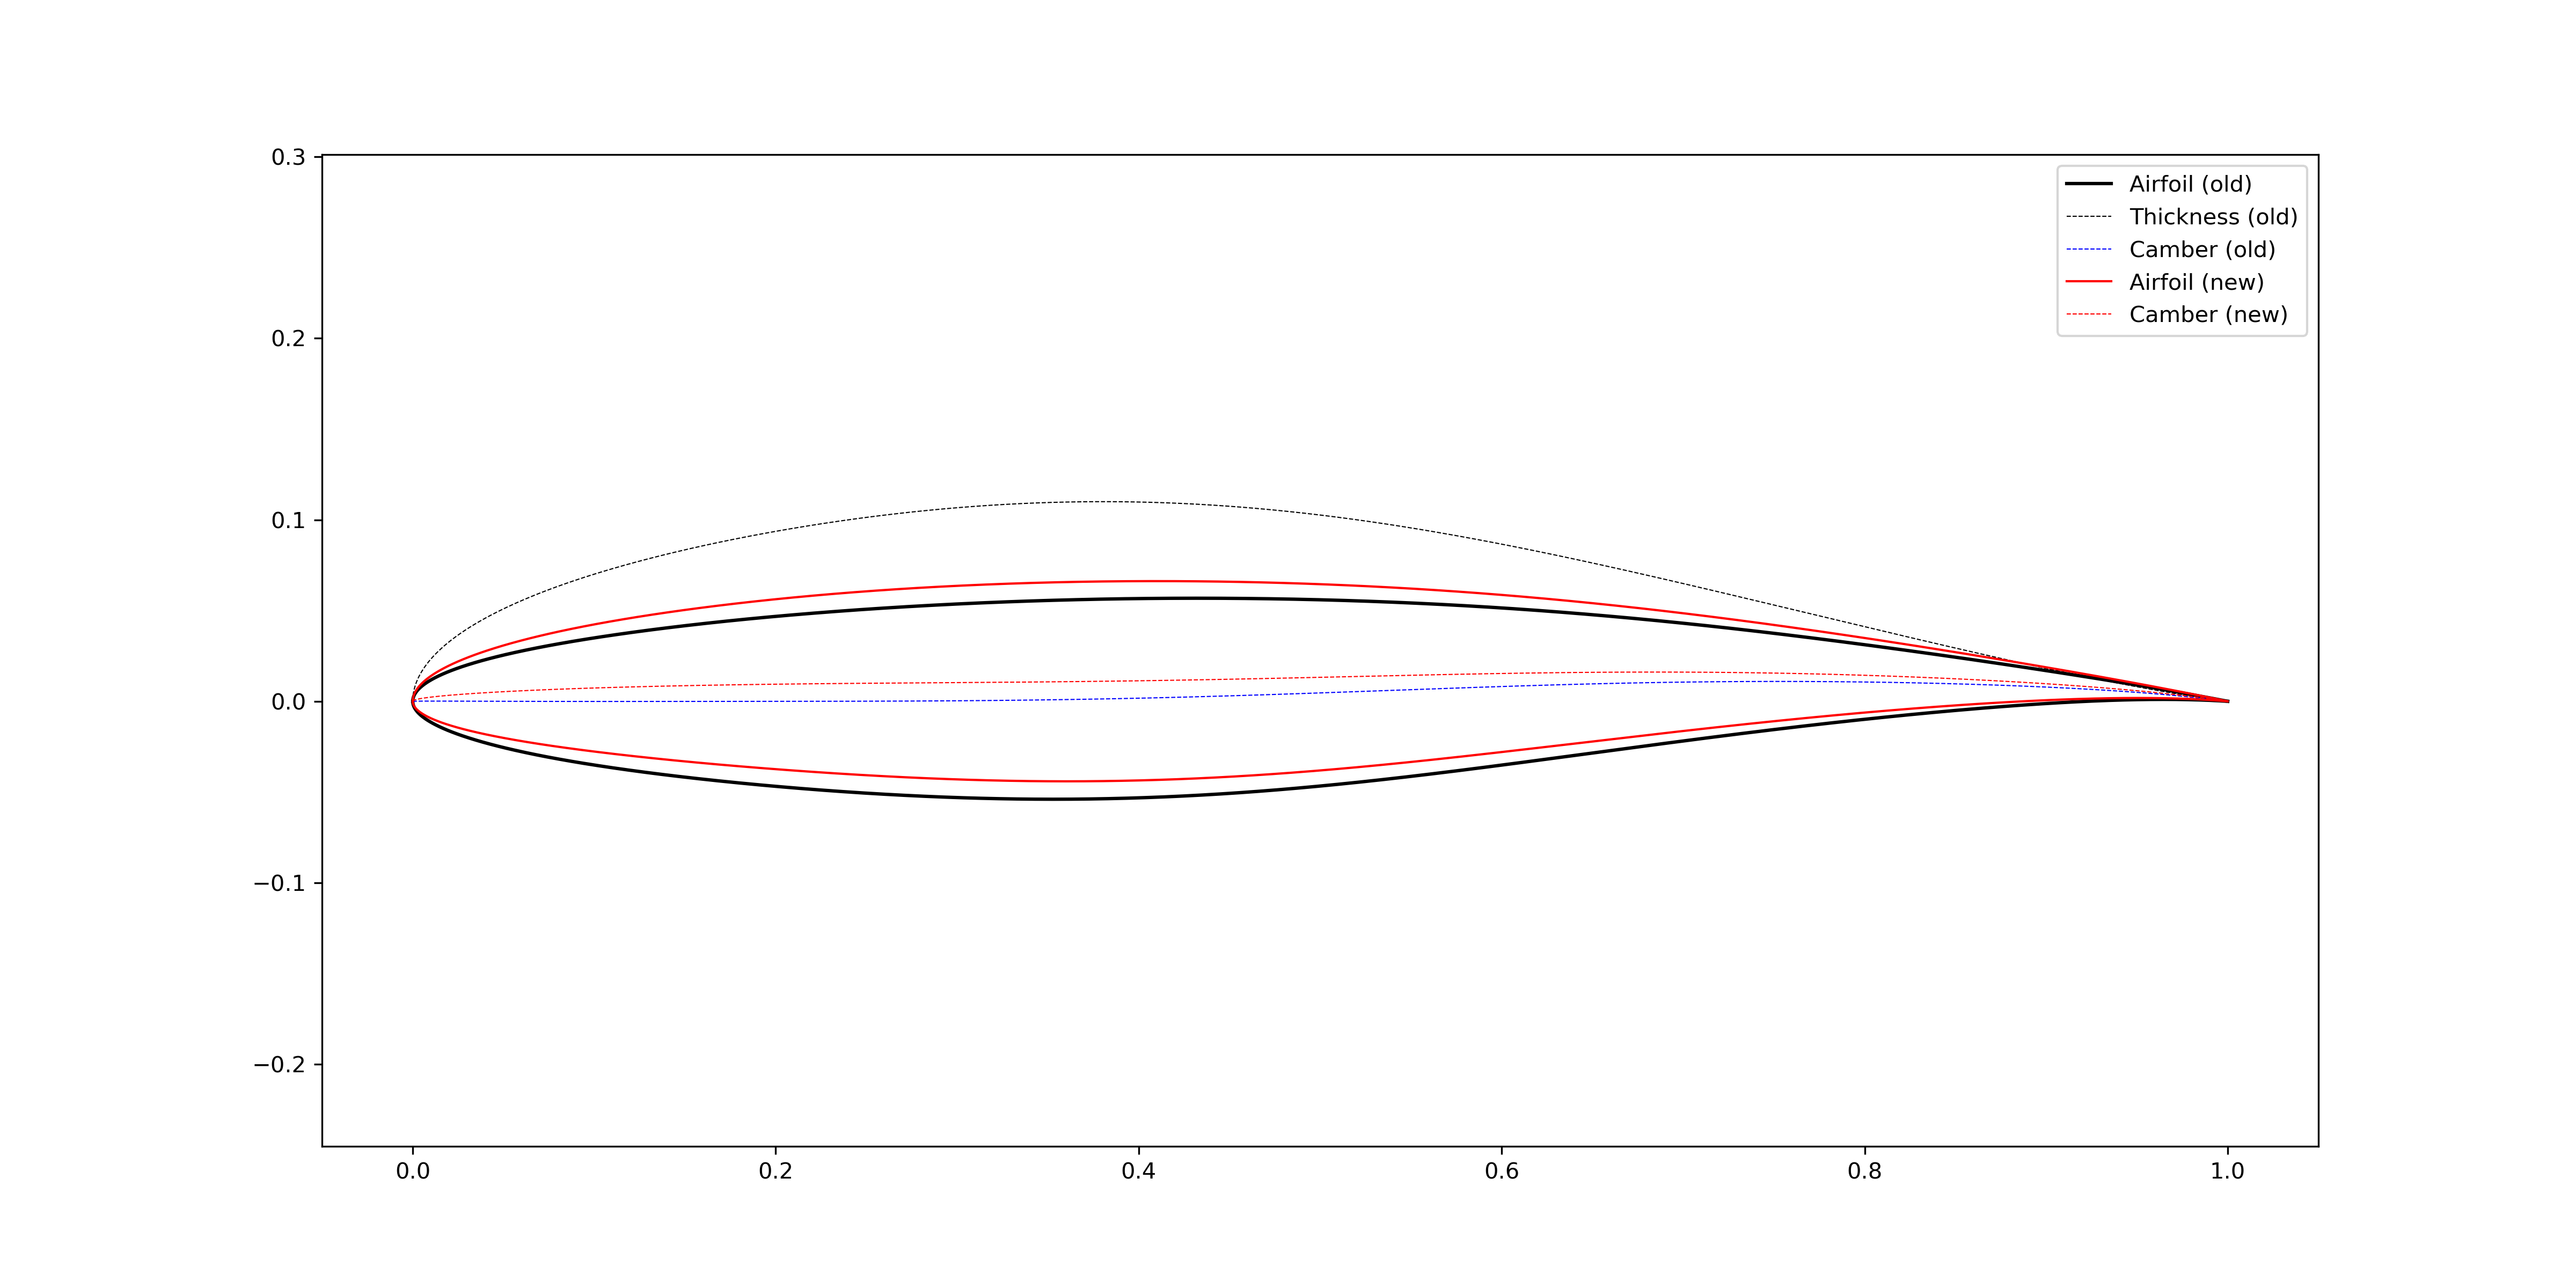
Figure 3.1.7 Increase airfoil camber in a global sense (bump center = 0.3)
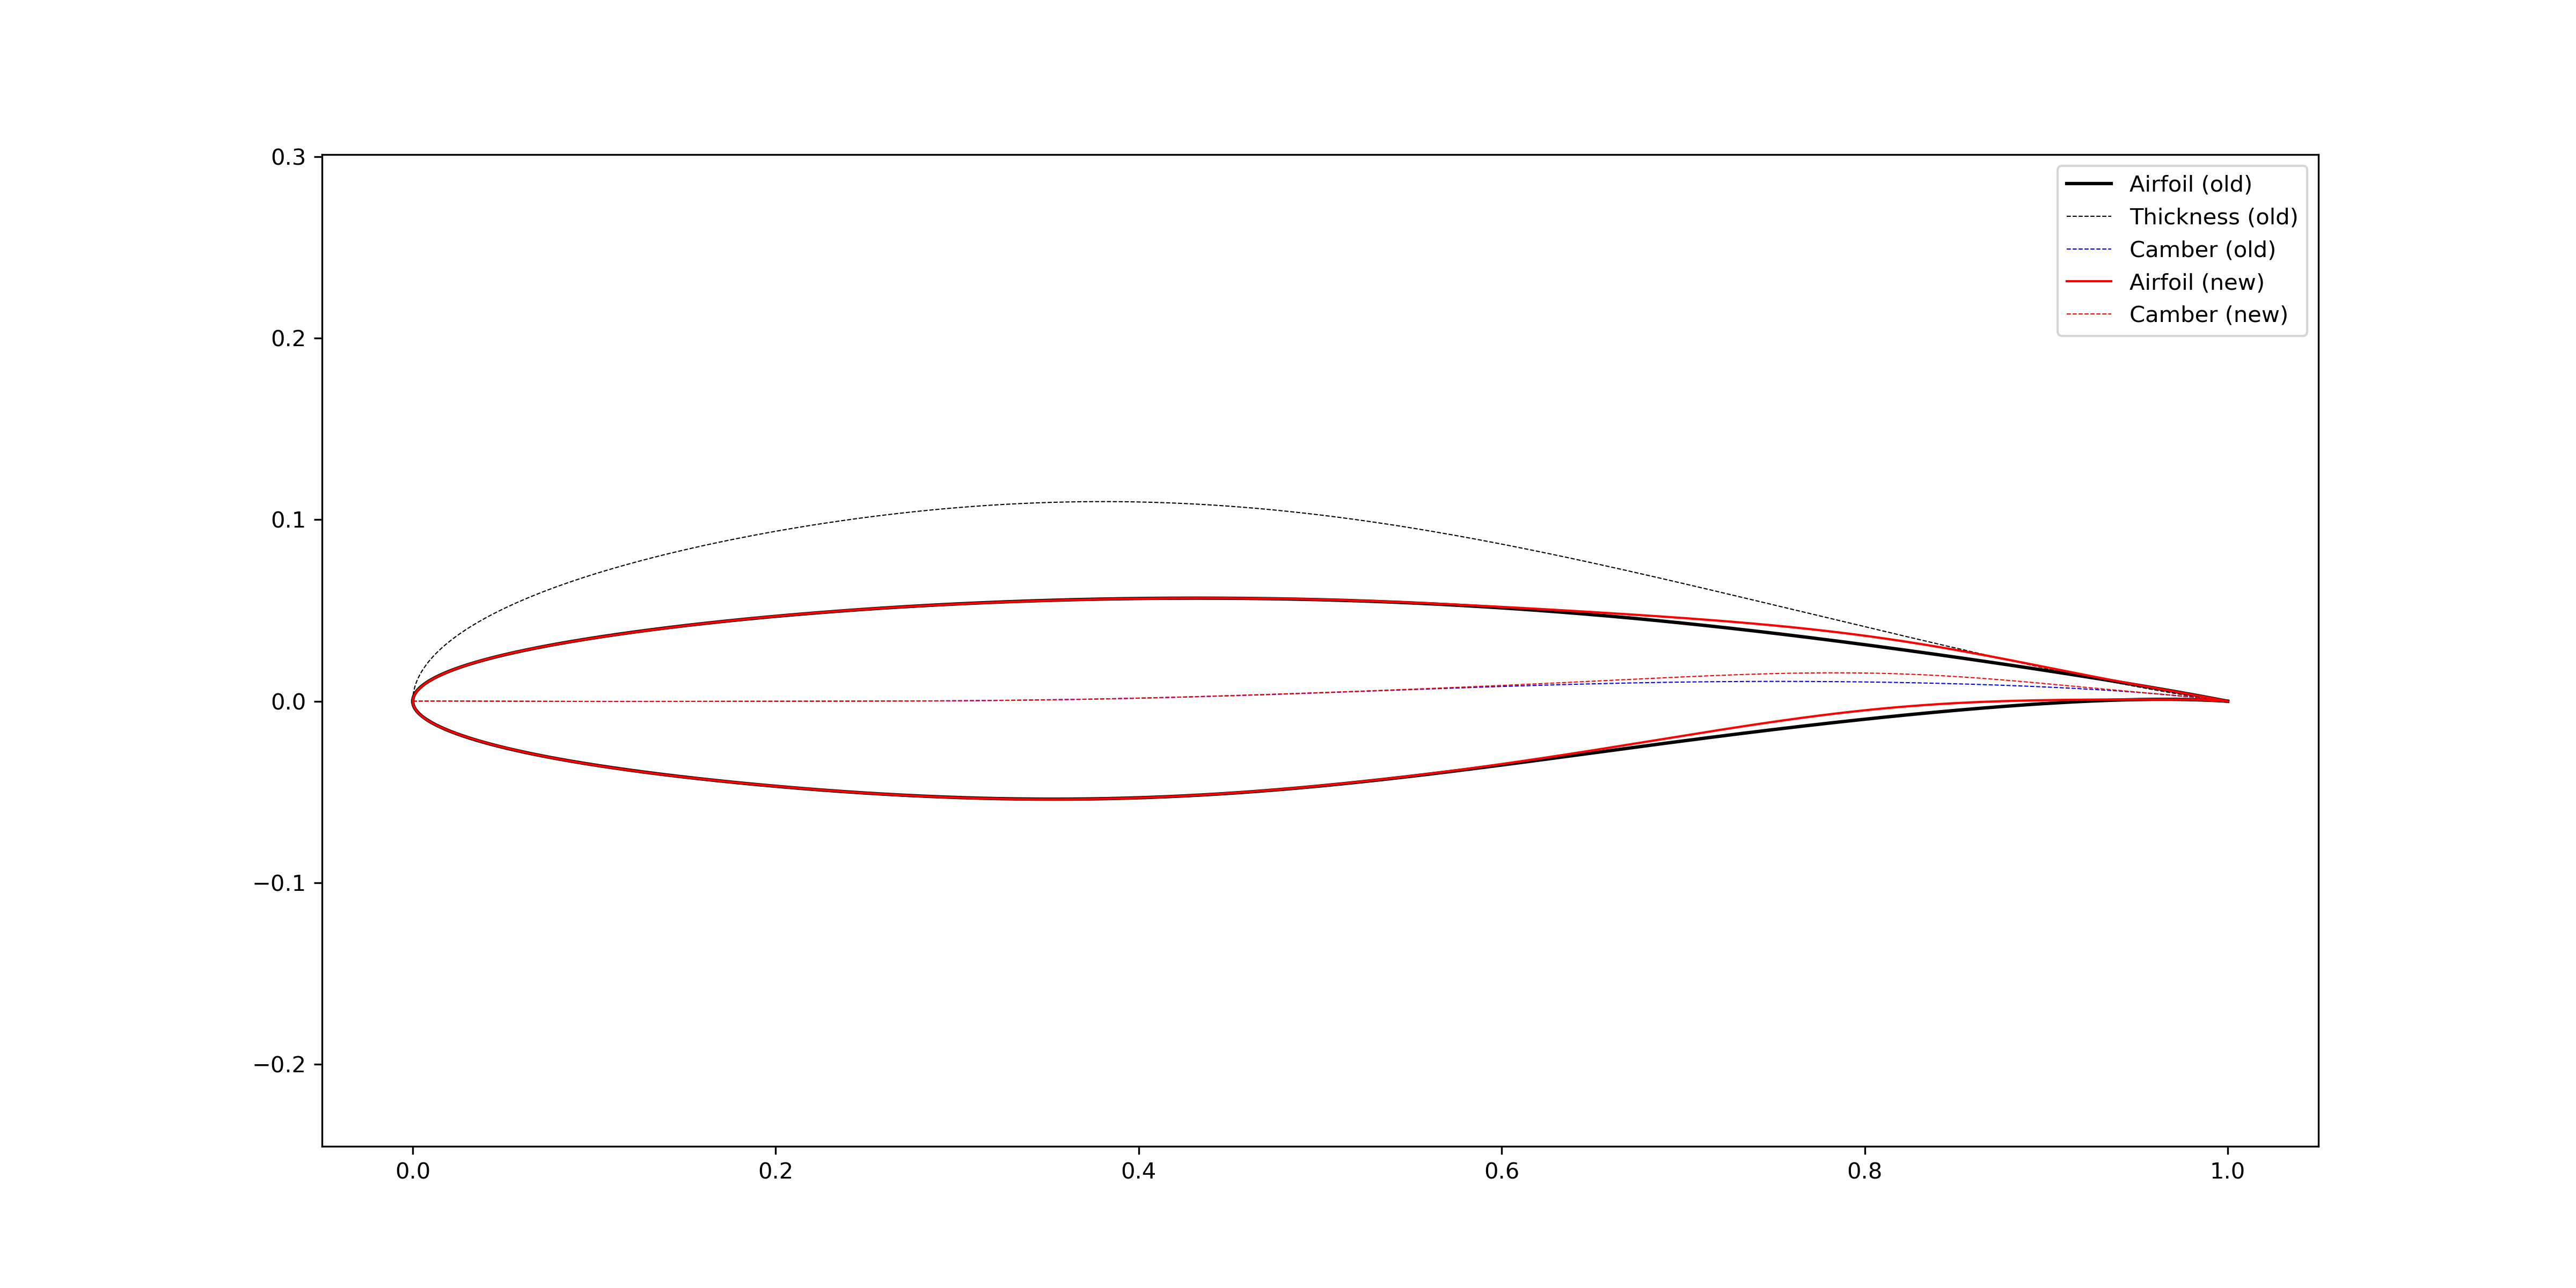
Figure 3.1.8 Increase airfoil camber in the aft loading region (bump center = 0.8)
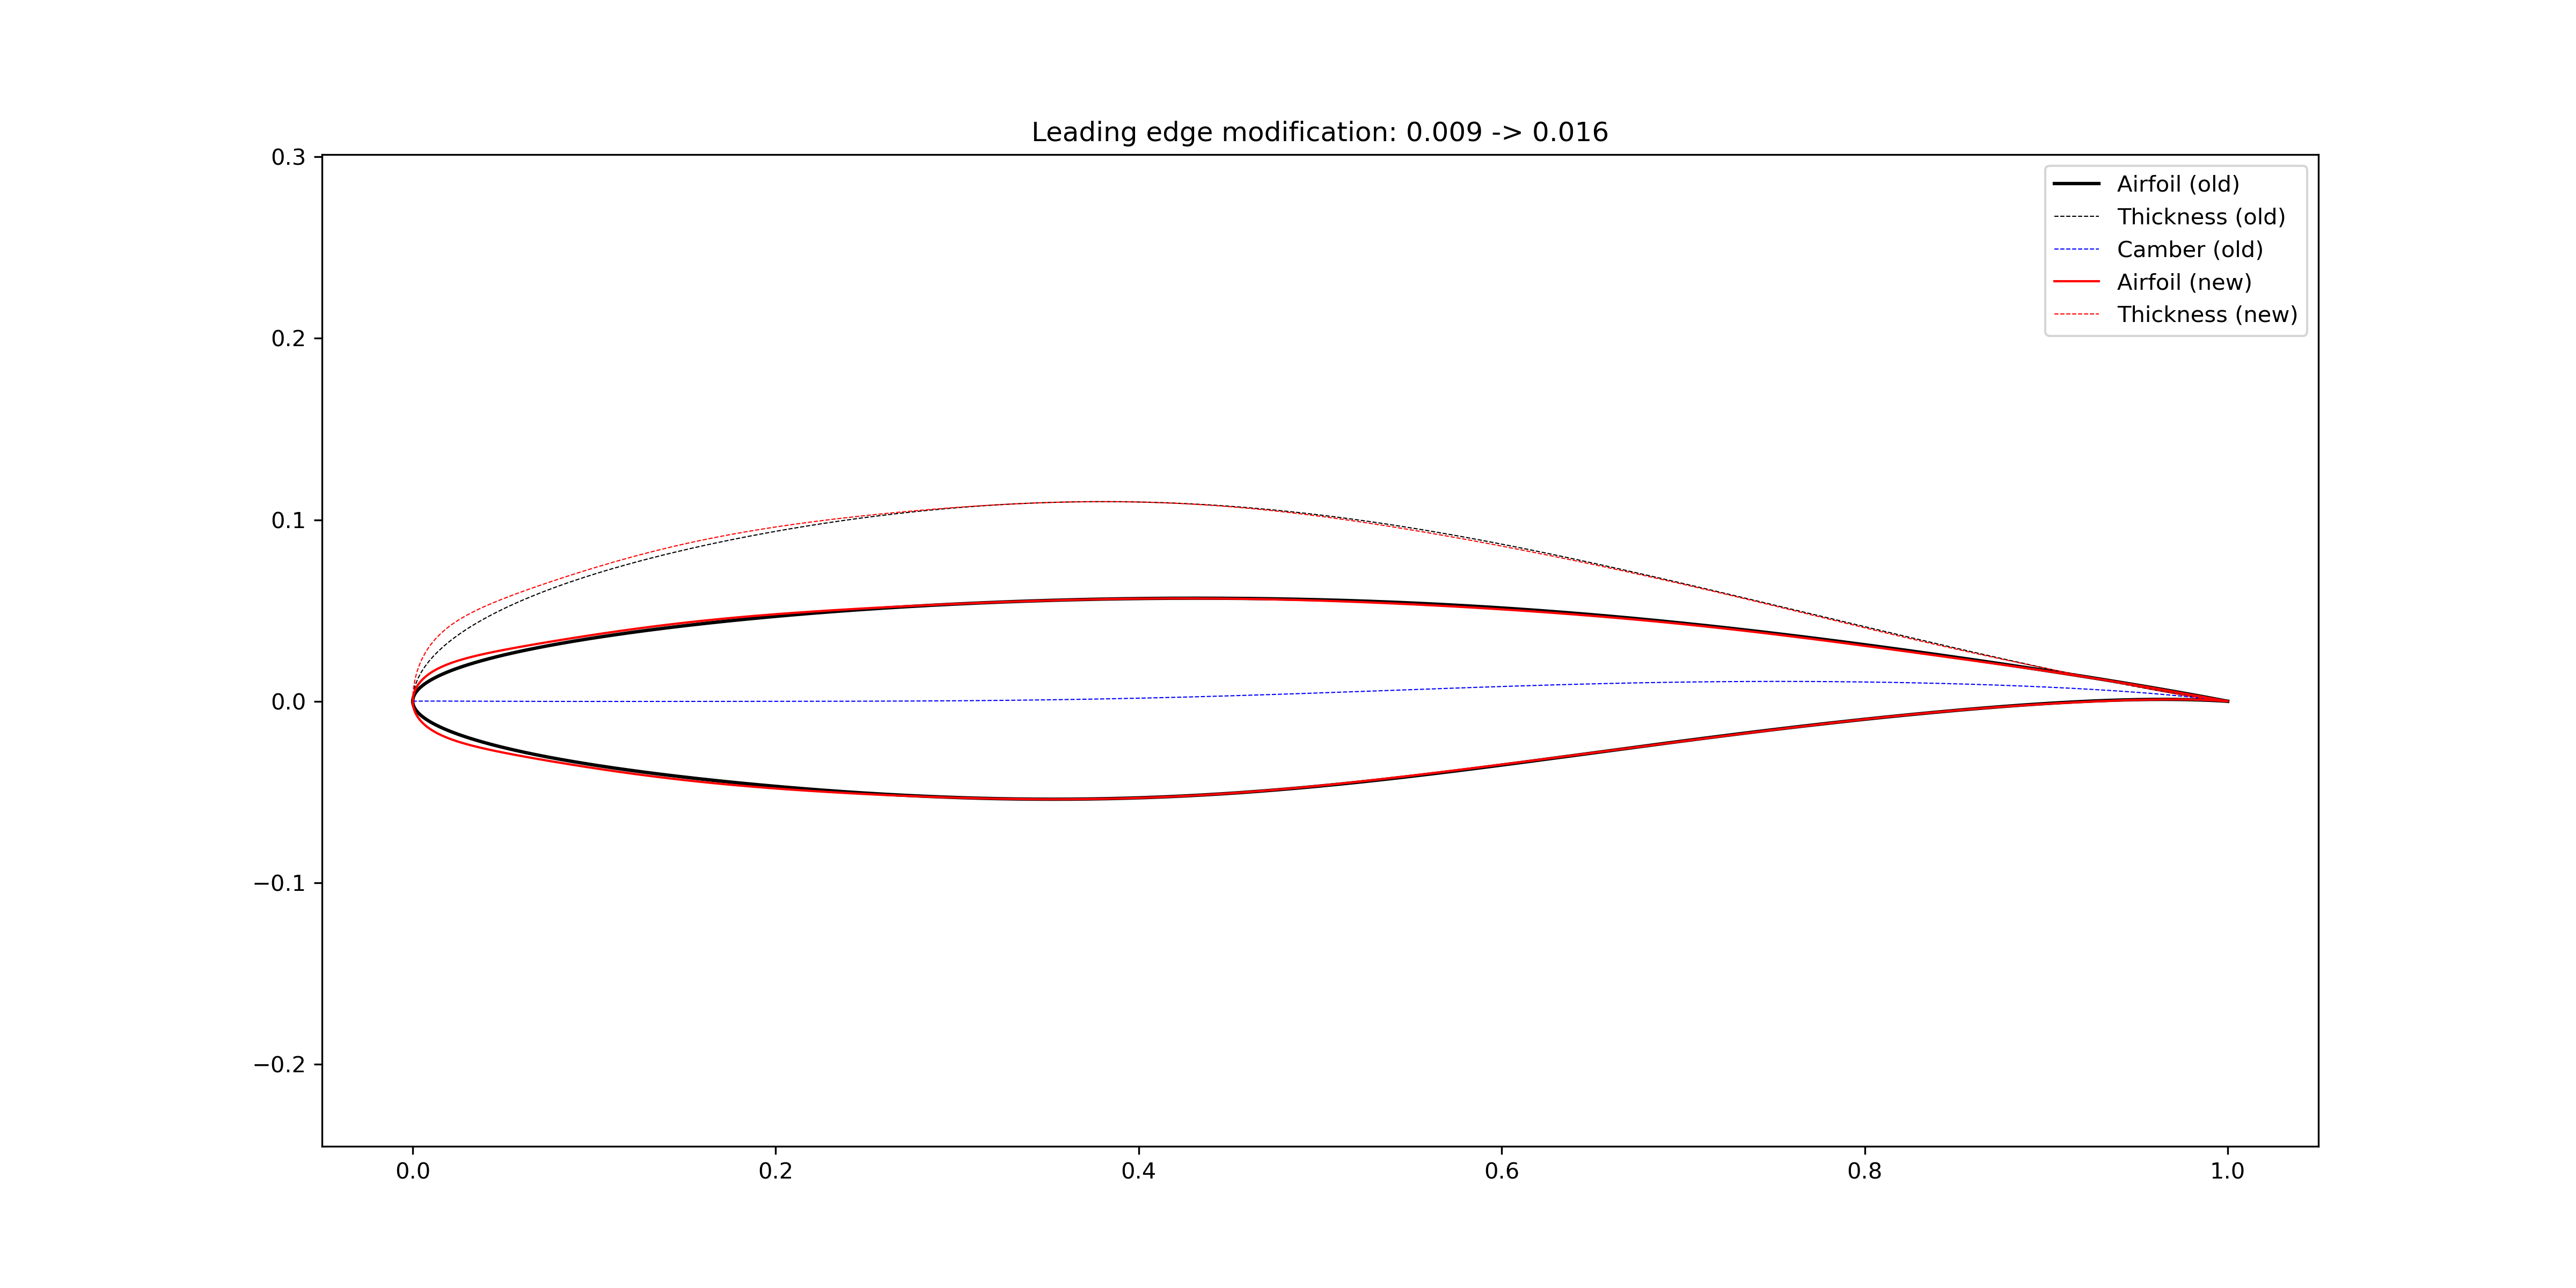
Figure 3.1.9 Increase airfoil leading edge radius
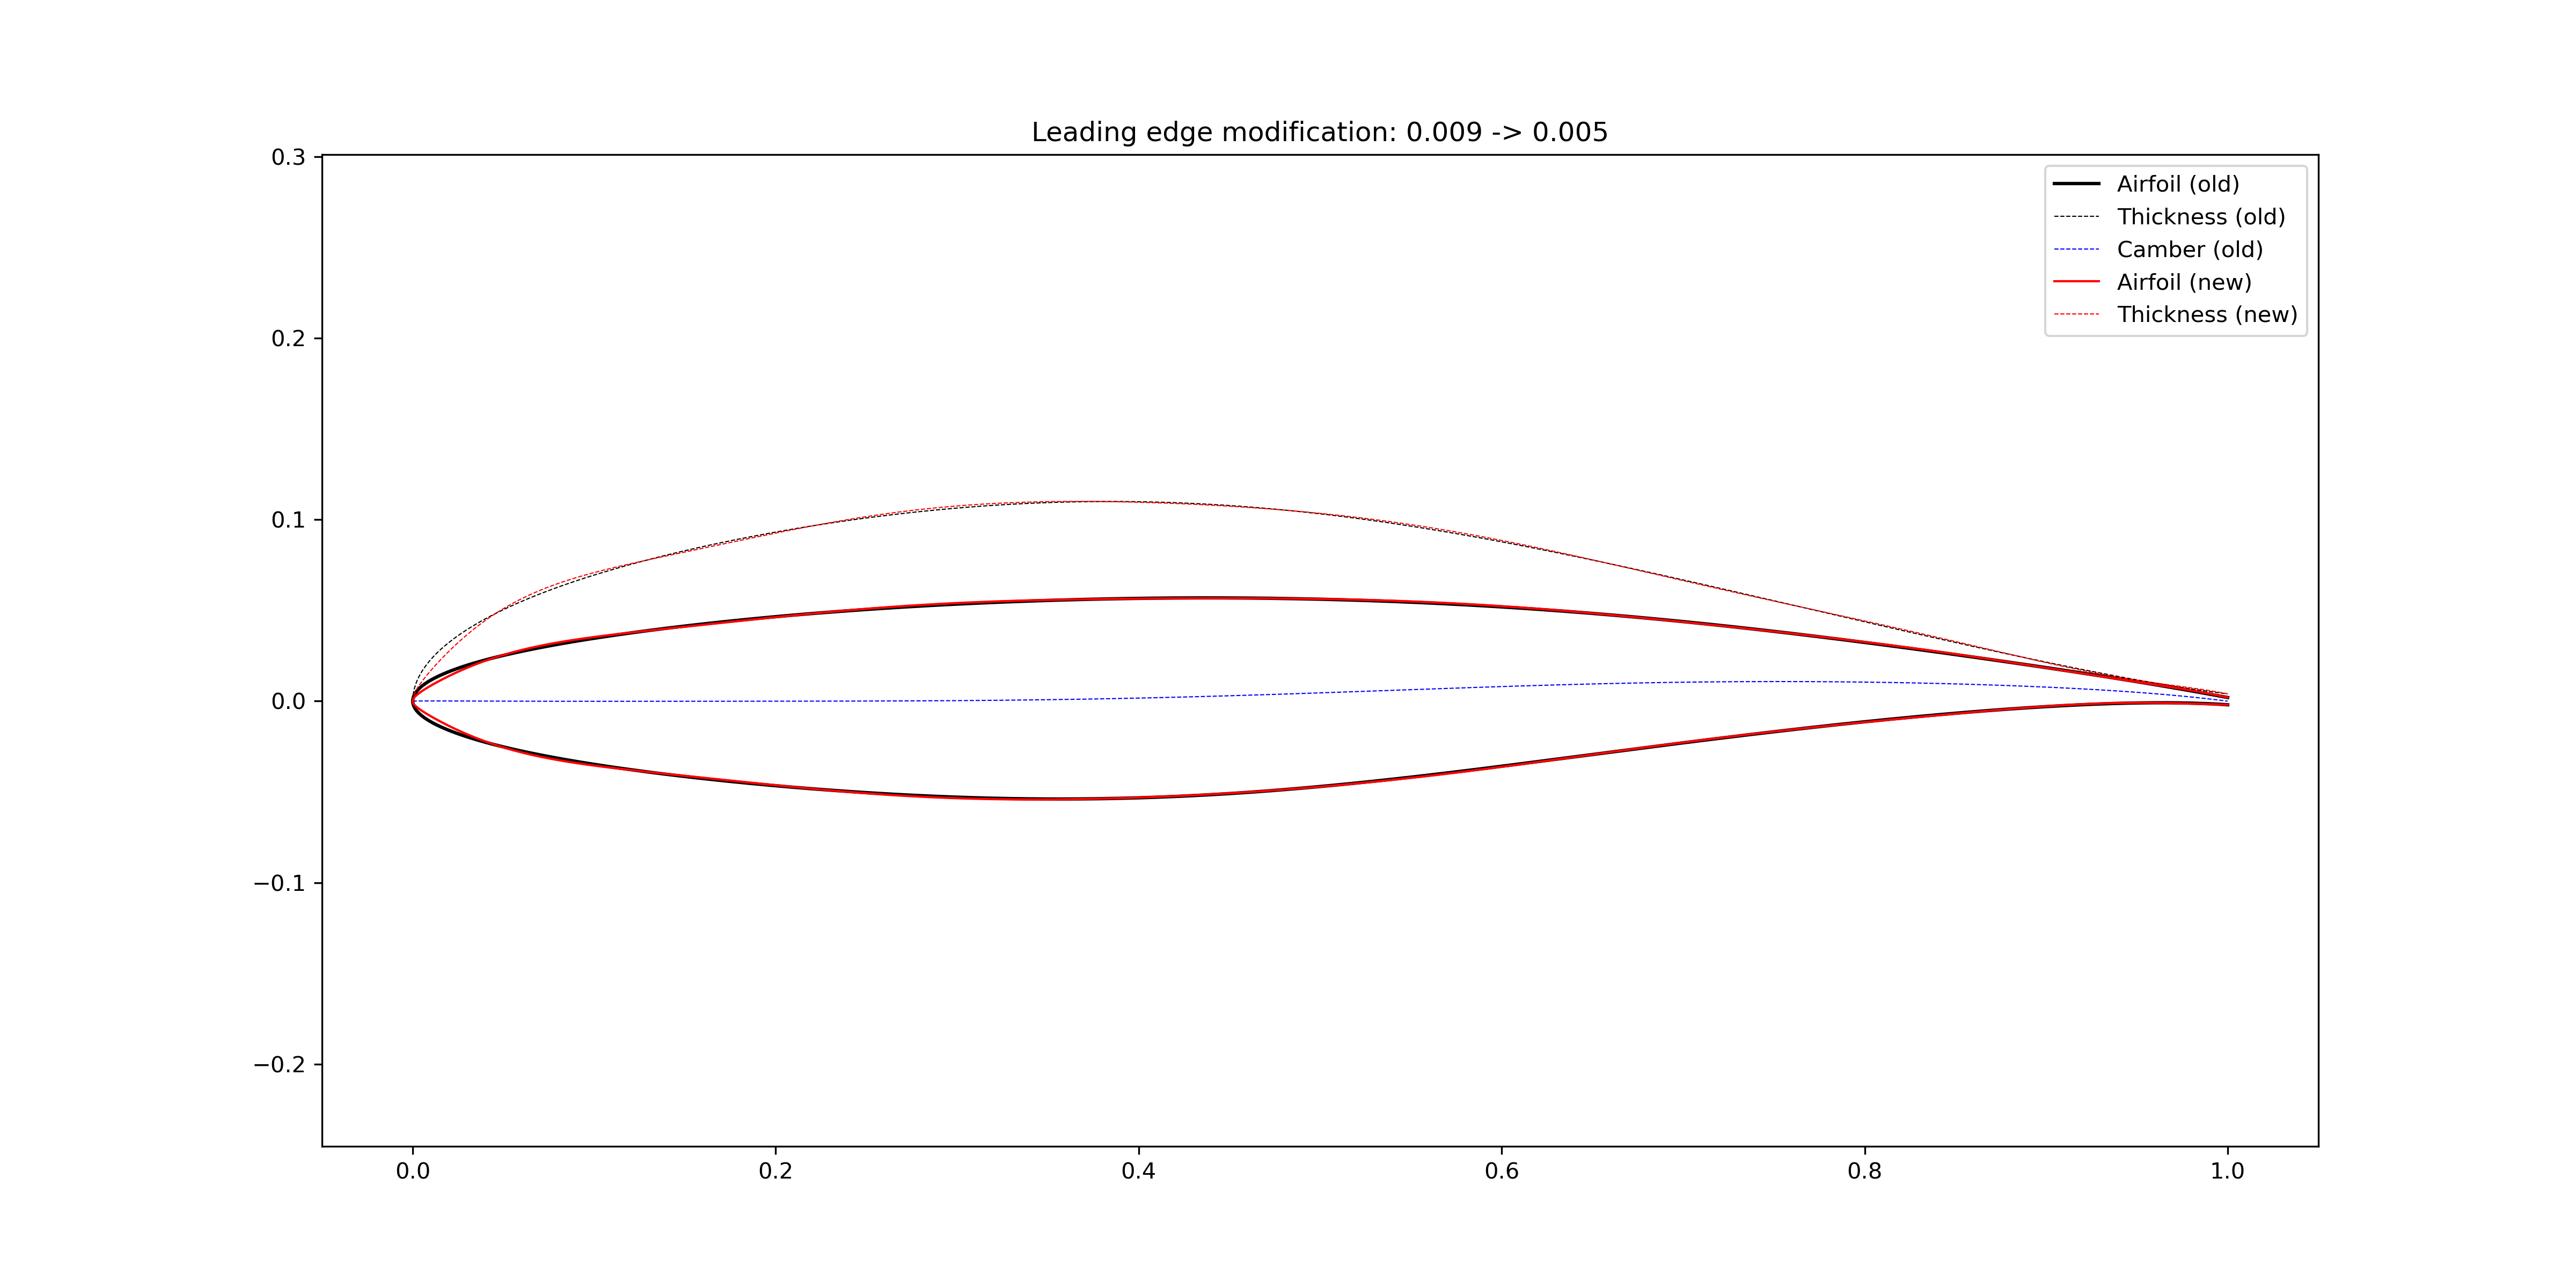
Figure 3.1.10 Reduce airfoil leading edge radius

Figure 3.1.11 Increase airfoil trailing edge wedge angle
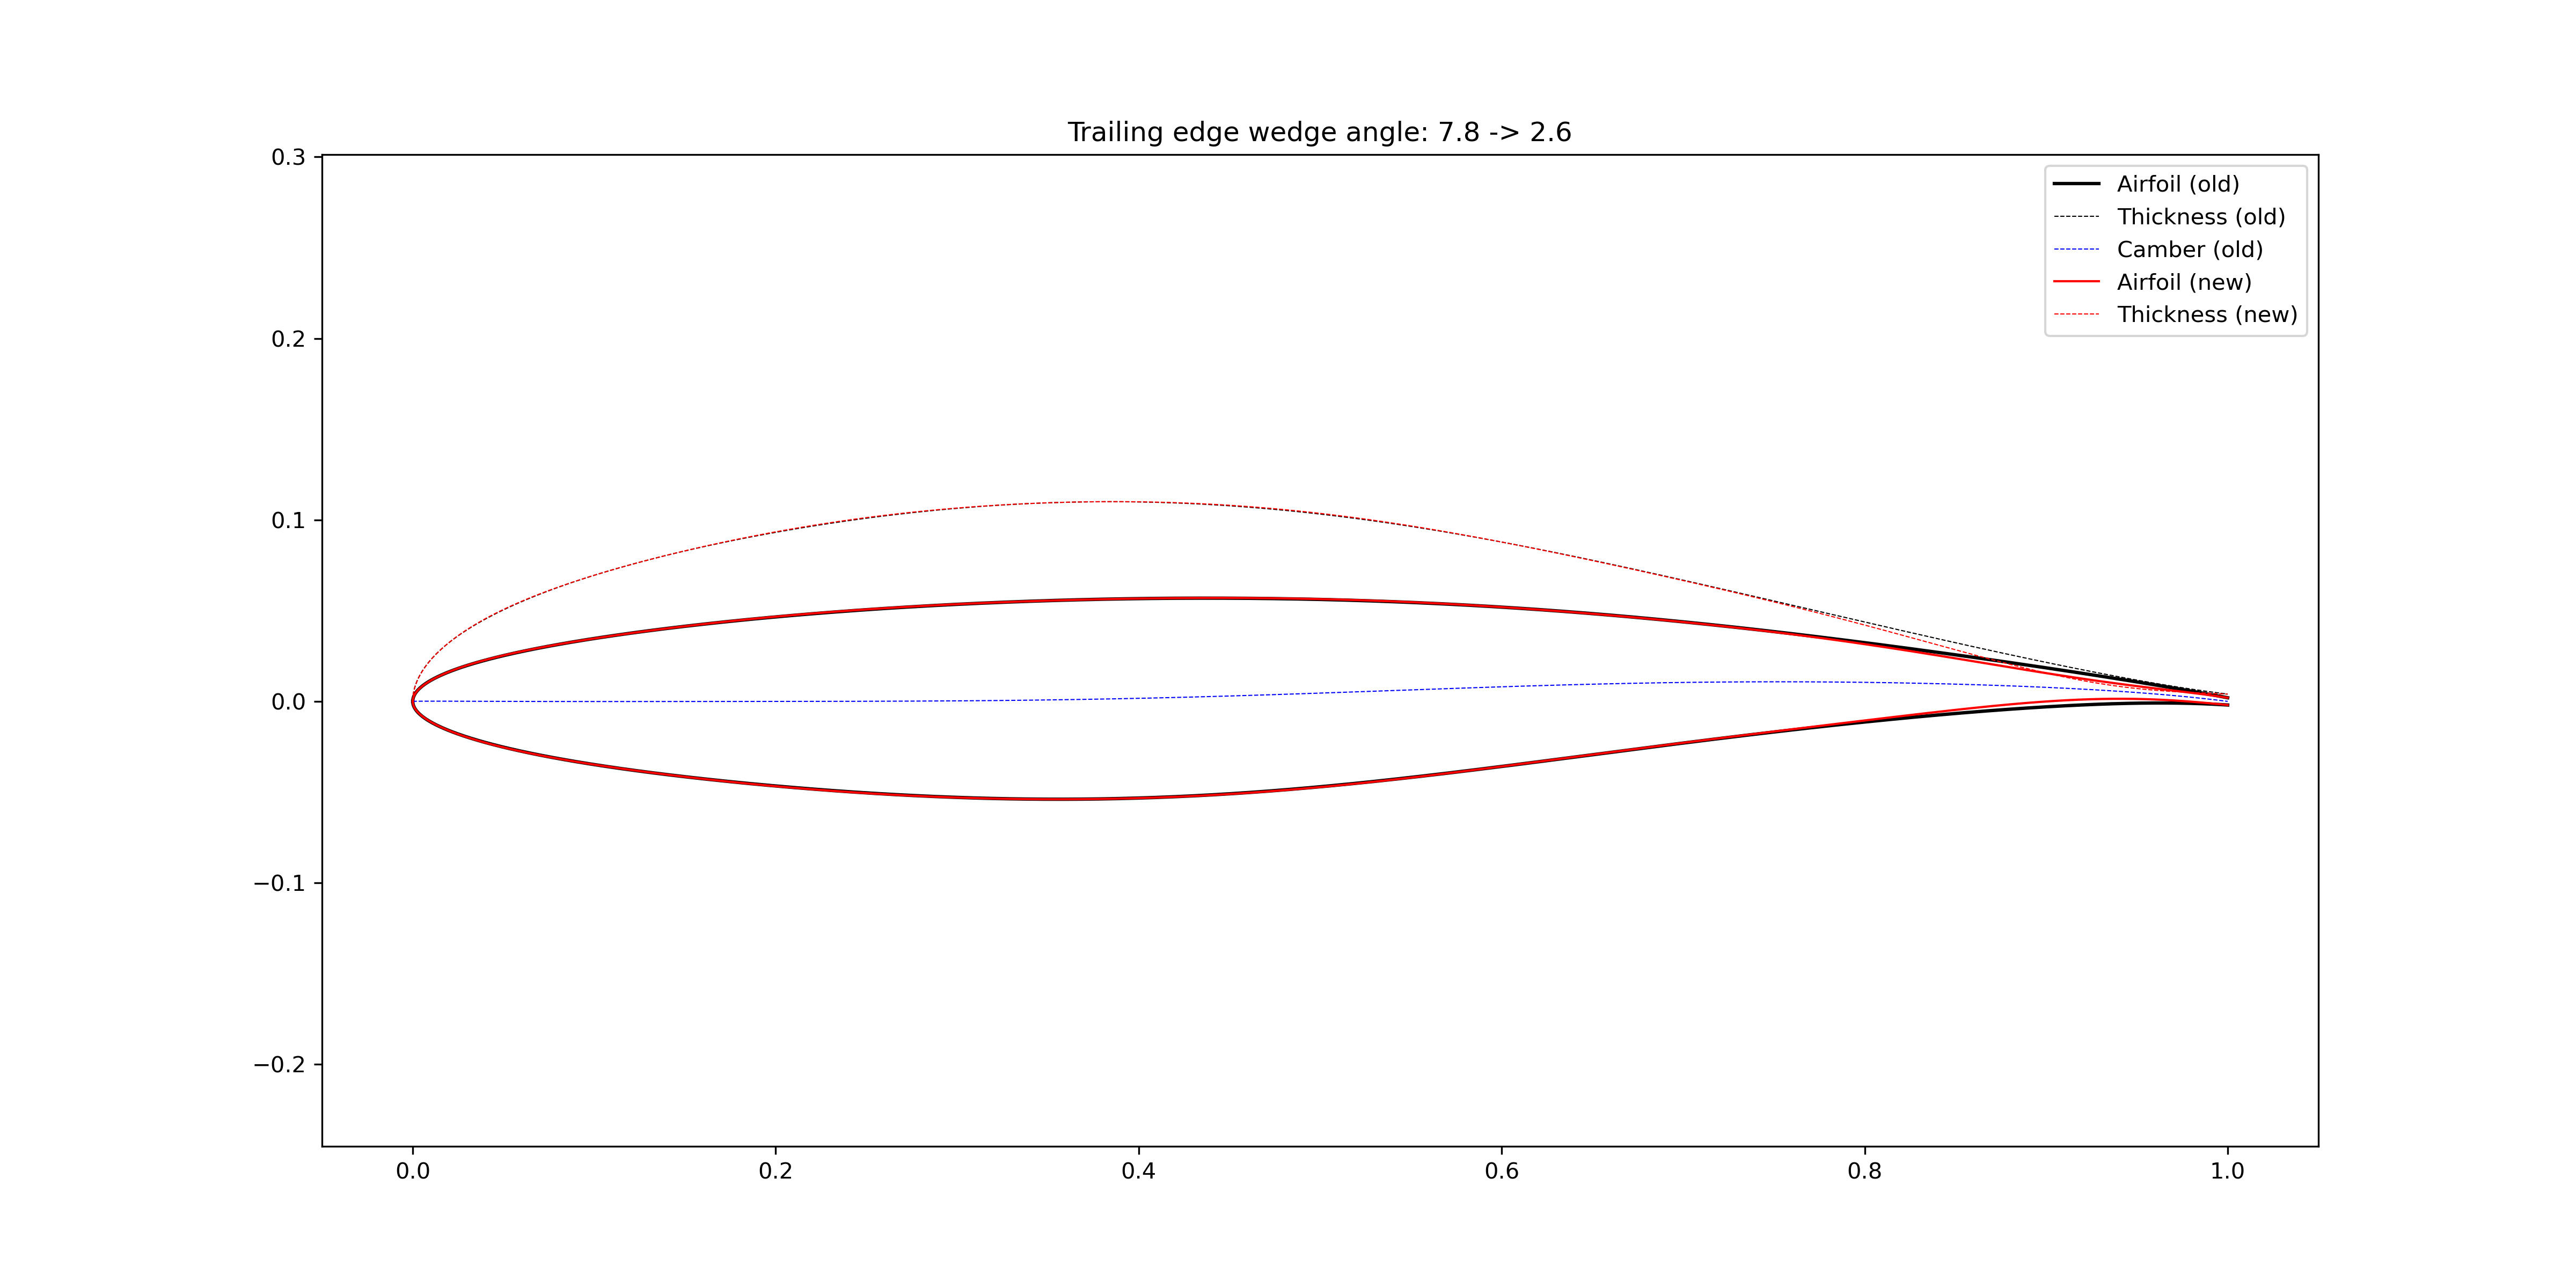
Figure 3.1.12 Reduce airfoil trailing edge wedge angle
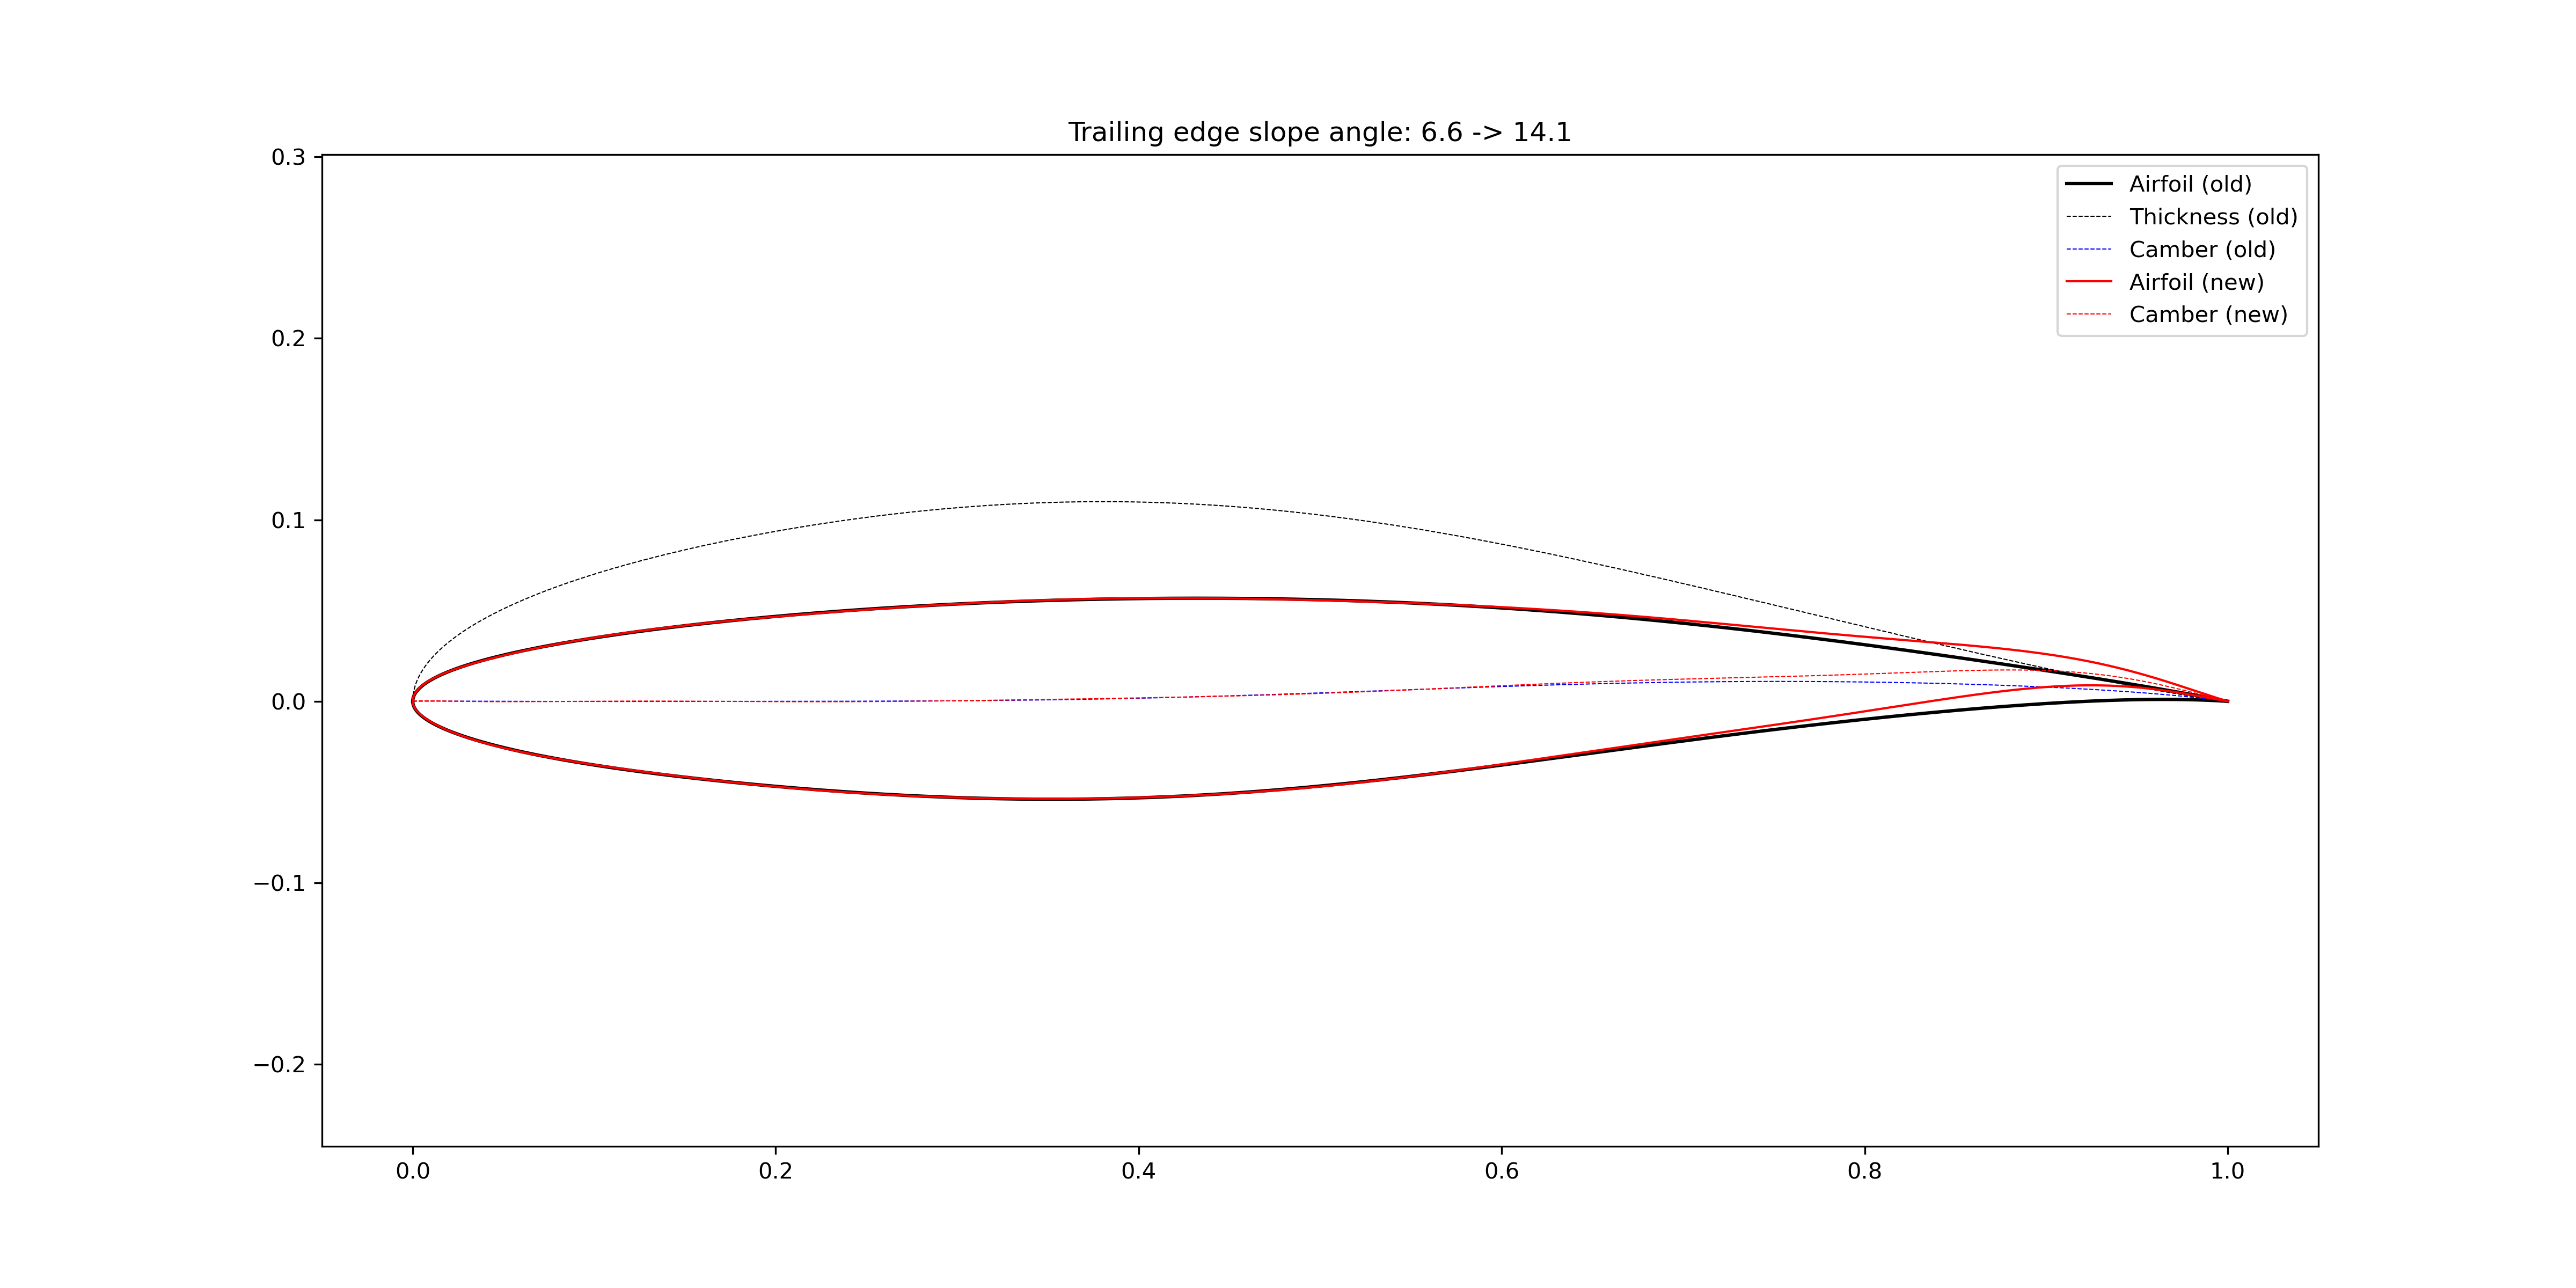
Figure 3.1.13 Increase airfoil trailing edge slope angle
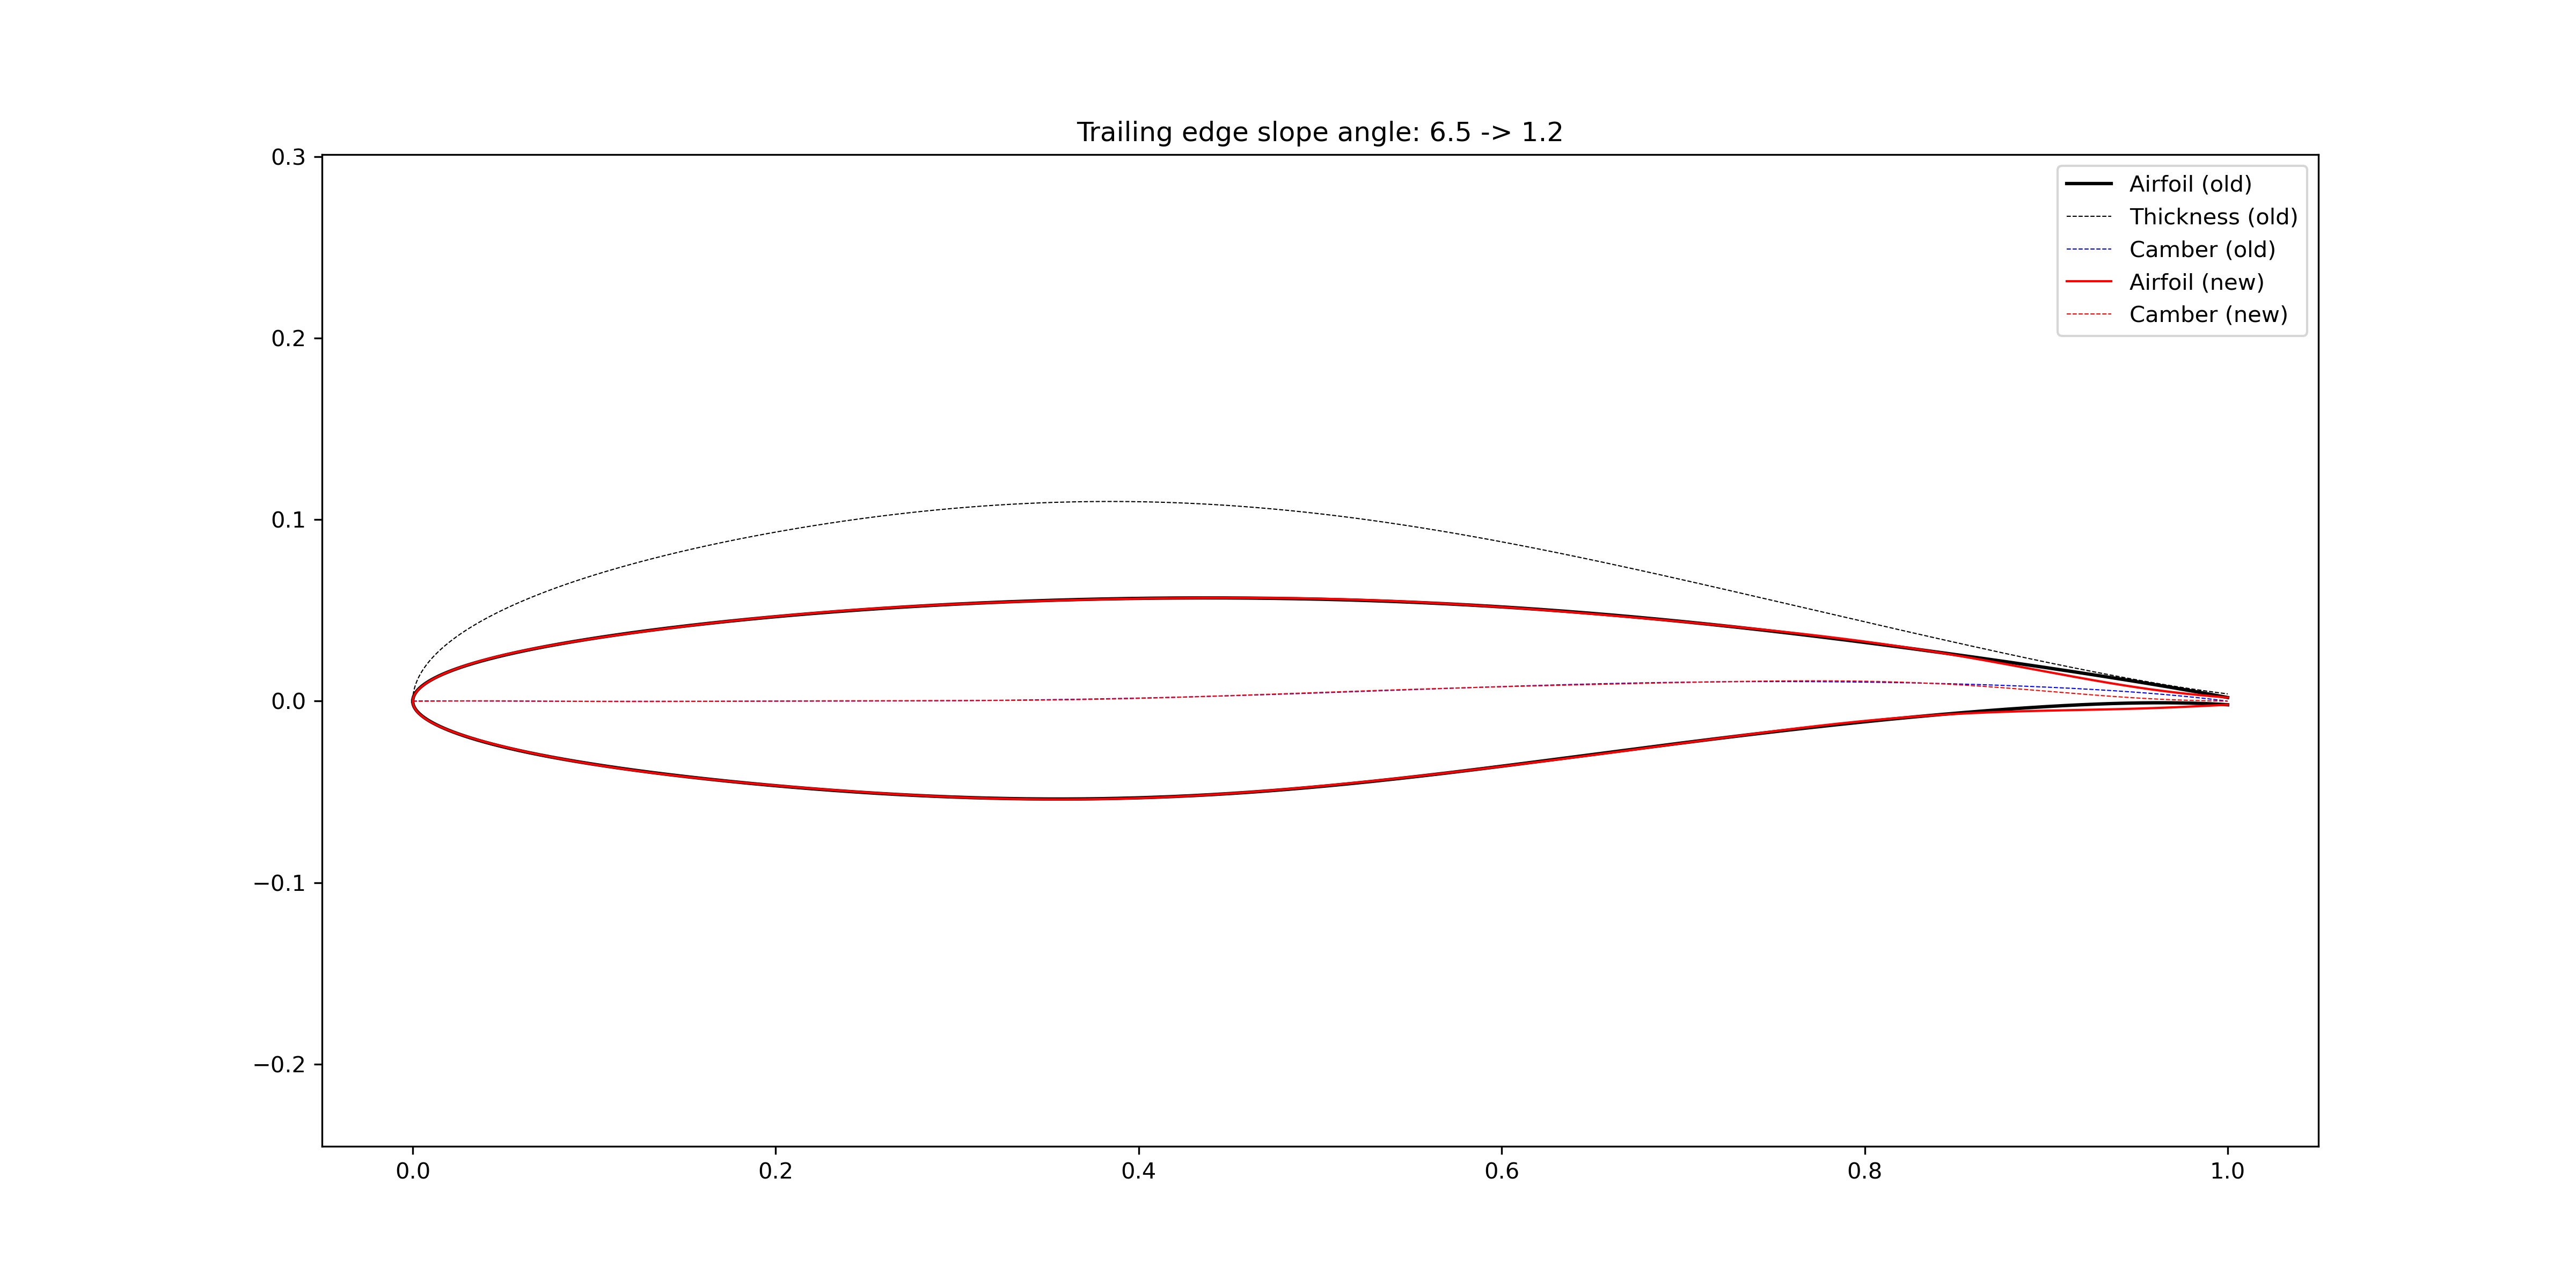
Figure 3.1.14 Reduce airfoil trailing edge slope angle
You can also directly add bumps to the airfoil surface. In Figure 3.1.15, a bump centered at \(x=0.30\) are added to the airfoil upper surface, and a bump centered at \(x=0.85\) are added to the airfoil lower surface. When the airfoil maximum thickness is kept the same, the lower surface is affected by adding the bump to the upper surface.
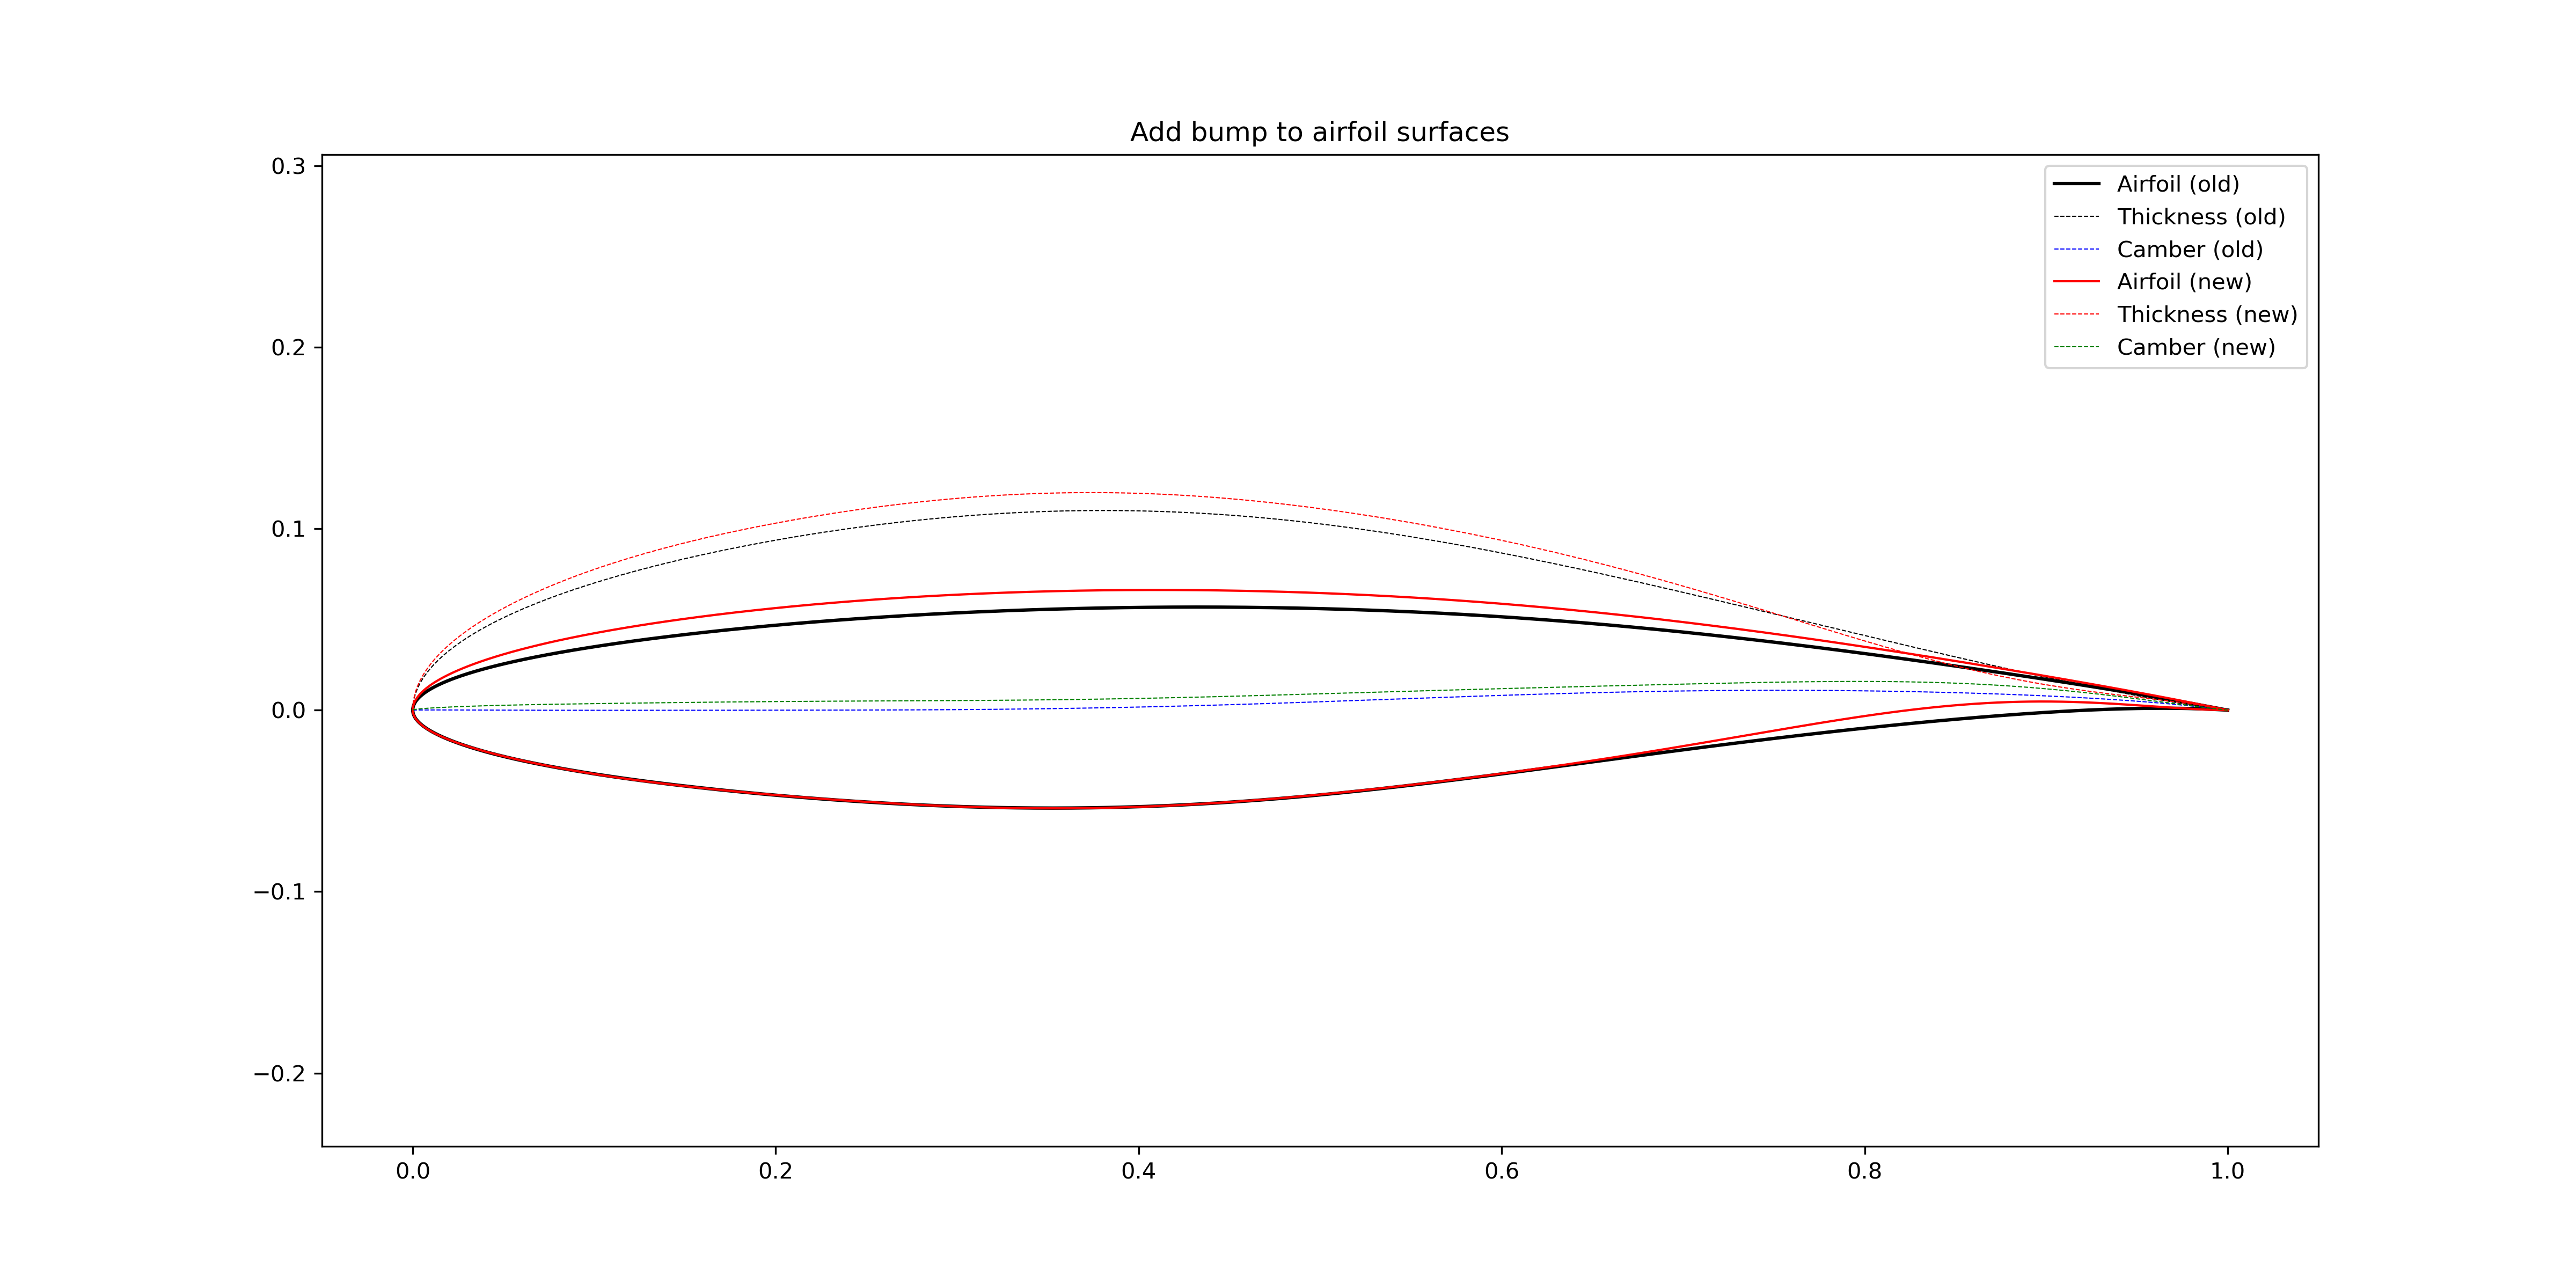
Figure 3.1.15 Add bumps to the airfoil surfaces (not keep the \(t_\text{max}\))
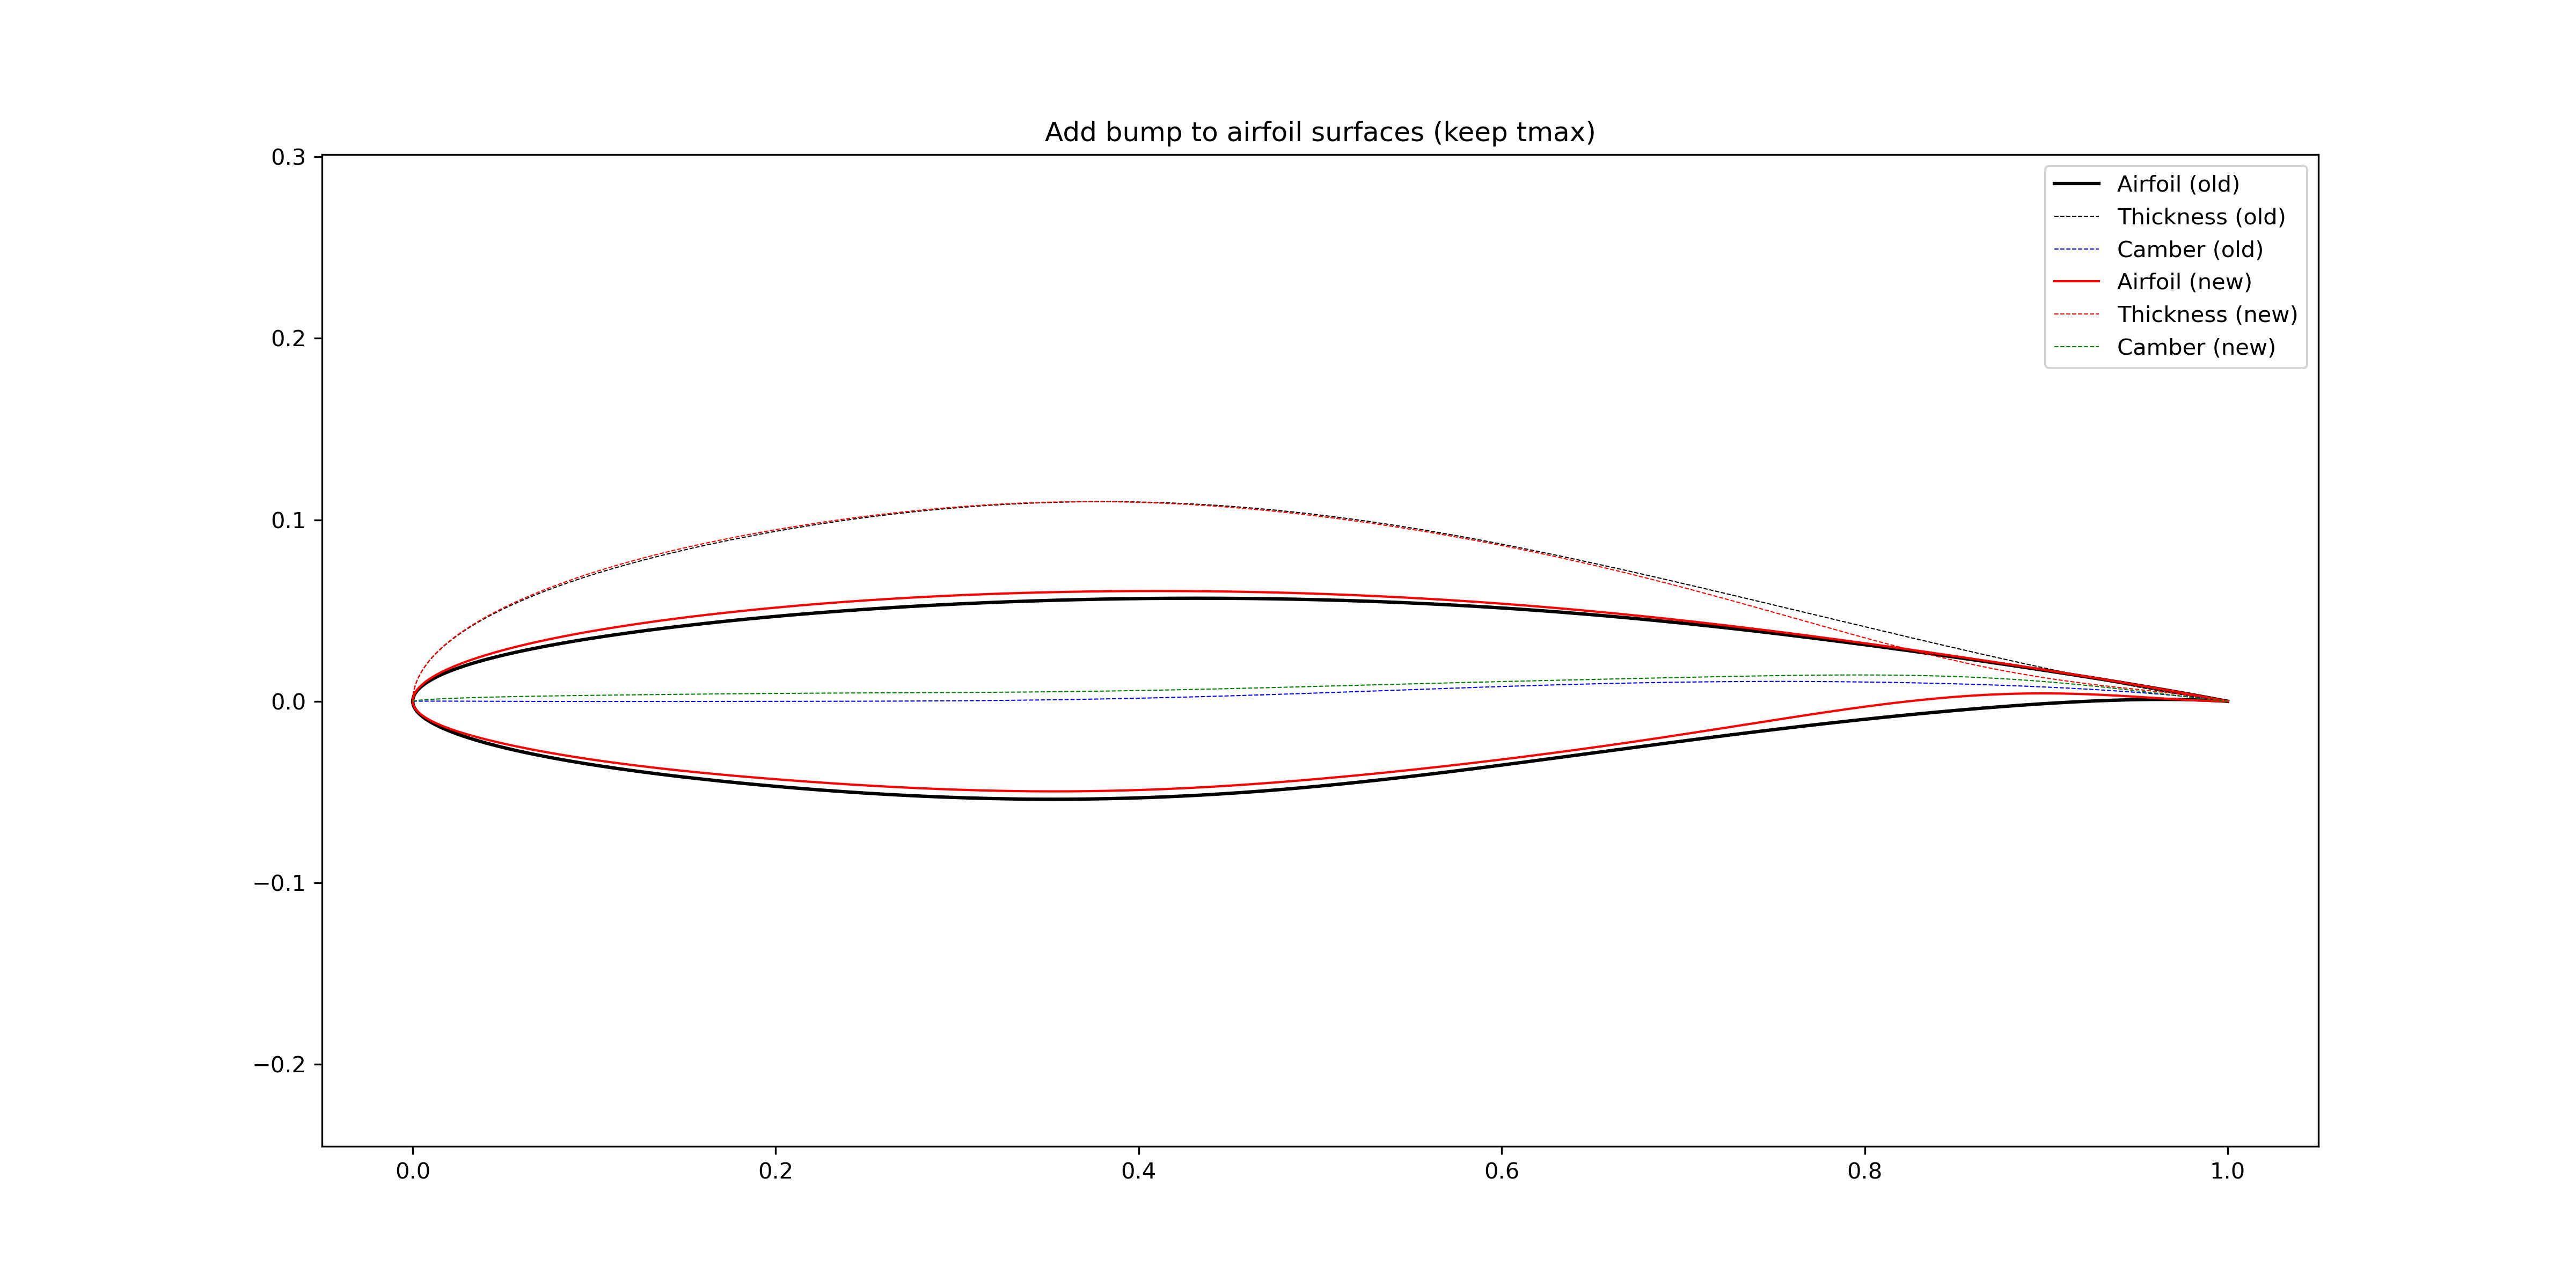
Figure 3.1.16 Add bumps to the airfoil surfaces (keep the \(t_\text{max}\))